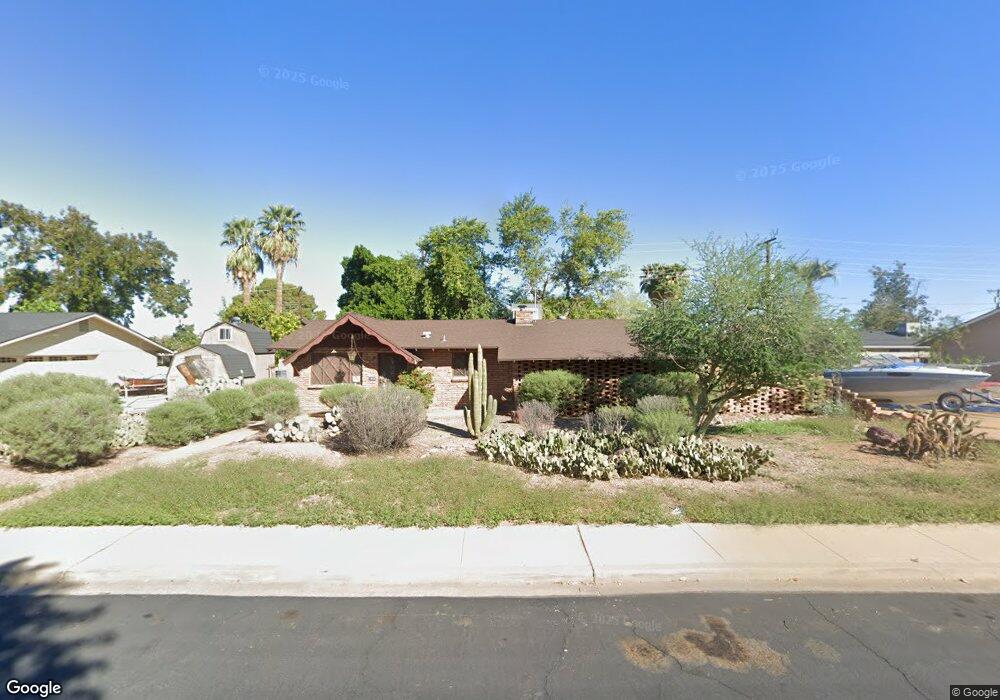
1018 W 11th St Mesa, AZ 85201
West Enders NeighborhoodEstimated Value: $448,858 - $554,000
Studio
3
Baths
2,140
Sq Ft
$243/Sq Ft
Est. Value
About This Home
This home is located at 1018 W 11th St, Mesa, AZ 85201 and is currently estimated at $520,965, approximately $243 per square foot. 1018 W 11th St is a home located in Maricopa County with nearby schools including Franklin at Brimhall Elementary School, Emerson Elementary School, and Franklin West Elementary School.
Ownership History
Date
Name
Owned For
Owner Type
Purchase Details
Closed on
Nov 15, 2006
Sold by
Ulrich Karen L
Bought by
Ulrich Kent E
Current Estimated Value
Home Financials for this Owner
Home Financials are based on the most recent Mortgage that was taken out on this home.
Original Mortgage
$185,000
Outstanding Balance
$109,859
Interest Rate
6.28%
Mortgage Type
Purchase Money Mortgage
Estimated Equity
$411,106
Purchase Details
Closed on
Jan 20, 2005
Sold by
Ulrich Karen L
Bought by
Ulrich Kent E and Ulrich Karen L
Purchase Details
Closed on
Mar 16, 2002
Sold by
Addison Rhonda L
Bought by
Addison Roy L
Create a Home Valuation Report for This Property
The Home Valuation Report is an in-depth analysis detailing your home's value as well as a comparison with similar homes in the area
Home Values in the Area
Average Home Value in this Area
Purchase History
| Date | Buyer | Sale Price | Title Company |
|---|---|---|---|
| Ulrich Kent E | -- | Transnation Title Ins Co | |
| Ulrich Karen L | -- | Transnation Title Ins Co | |
| Ulrich Kent E | -- | -- | |
| Addison Roy L | -- | -- |
Source: Public Records
Mortgage History
| Date | Status | Borrower | Loan Amount |
|---|---|---|---|
| Open | Ulrich Kent E | $185,000 |
Source: Public Records
Tax History
| Year | Tax Paid | Tax Assessment Tax Assessment Total Assessment is a certain percentage of the fair market value that is determined by local assessors to be the total taxable value of land and additions on the property. | Land | Improvement |
|---|---|---|---|---|
| 2025 | $1,787 | $20,805 | -- | -- |
| 2024 | $1,806 | $19,815 | -- | -- |
| 2023 | $1,806 | $34,820 | $6,960 | $27,860 |
| 2022 | $1,763 | $27,680 | $5,530 | $22,150 |
| 2021 | $1,818 | $23,970 | $4,790 | $19,180 |
| 2020 | $1,798 | $22,960 | $4,590 | $18,370 |
| 2019 | $1,277 | $19,270 | $3,850 | $15,420 |
| 2018 | $1,219 | $17,030 | $3,400 | $13,630 |
| 2017 | $1,181 | $16,060 | $3,210 | $12,850 |
| 2016 | $1,159 | $14,770 | $2,950 | $11,820 |
| 2015 | $1,094 | $14,030 | $2,800 | $11,230 |
Source: Public Records
Map
Nearby Homes
- 860 W Mountain View Dr
- 1229 N Alma School Rd Unit 1
- 1027 N Revere
- 805 N Westwood
- 1500 N Markdale Unit 41
- 861 N Revere Unit E
- 920 N Cherry
- 837 N Revere Unit E
- 816 N Revere
- 1051 W Dixon St
- 1265 W Ellis St
- 1048 W Heather Dr
- 1032 W 6th Place
- 1301 W Rio Salado Pkwy Unit 15
- 1301 W Rio Salado Pkwy Unit 22
- 1301 W Rio Salado Pkwy Unit 51
- 1301 W Rio Salado Pkwy Unit 1
- 1105 W 6th Place
- 1559 N Upland Cir
- 424 W Brown Rd Unit 105
- 1008 W 11th St
- 1028 W 11th St
- 1033 N Wick Cir
- 1027 N Wick Cir
- 1013 W 11th St
- 1023 W 11th St
- 1000 W 11th St
- 1038 W 11th St
- 1003 W 11th St
- 1045 W Mountain View Dr
- 1033 W 11th St
- 1021 N Wick Cir
- 1039 W Mountain View Dr
- 1055 W Mountain View Dr
- 1116 N Westwood
- 1018 W 10th Place
- 1008 W 10th Place
- 1028 W 10th Place
- 1013 N Wick Cir
- 1043 W 11th St
Your Personal Tour Guide
Ask me questions while you tour the home.