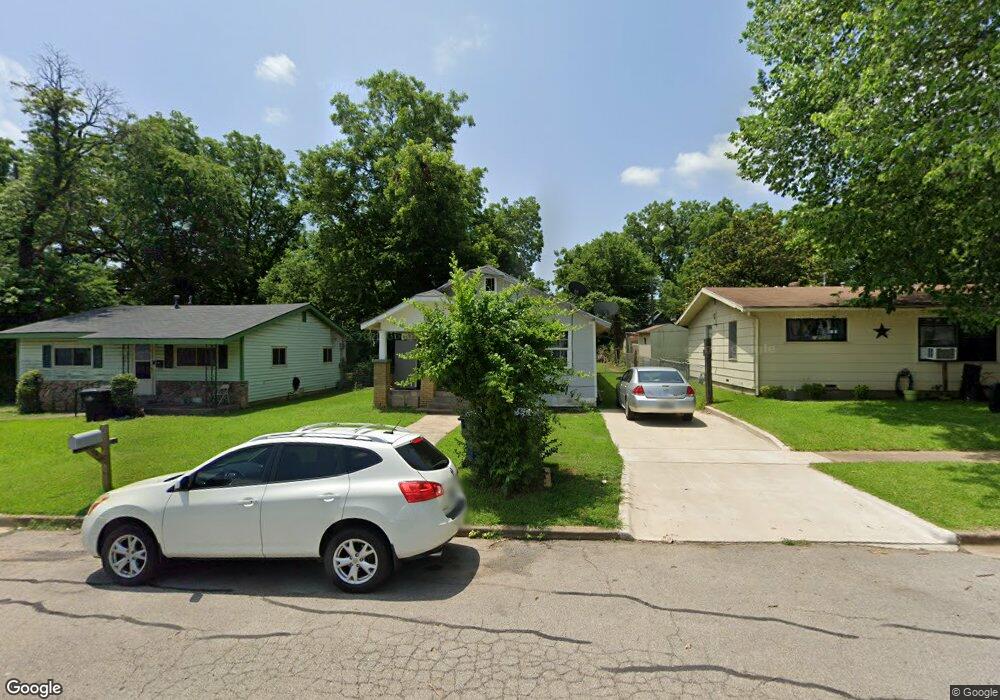
1018 W Owing St Denison, TX 75020
Estimated Value: $146,547 - $159,000
--
Bed
--
Bath
1,128
Sq Ft
$135/Sq Ft
Est. Value
About This Home
This home is located at 1018 W Owing St, Denison, TX 75020 and is currently estimated at $152,774, approximately $135 per square foot. 1018 W Owing St is a home located in Grayson County with nearby schools including Houston Elementary School, Scott Middle School, and Denison High School.
Ownership History
Date
Name
Owned For
Owner Type
Purchase Details
Closed on
Dec 2, 2015
Sold by
Coronel Soto Angela
Bought by
Dela Cruz Martinez Juan
Current Estimated Value
Purchase Details
Closed on
Oct 2, 2013
Sold by
S & D Properties
Bought by
Romano Simon M and Hernandez Rocio C
Home Financials for this Owner
Home Financials are based on the most recent Mortgage that was taken out on this home.
Original Mortgage
$5,600
Interest Rate
4.37%
Mortgage Type
New Conventional
Purchase Details
Closed on
Jul 30, 2013
Sold by
Agustin Sandra Margarita
Bought by
S And D Properties
Purchase Details
Closed on
Jan 21, 2013
Sold by
S & D Properties
Bought by
Agustin Sandra Margarita
Home Financials for this Owner
Home Financials are based on the most recent Mortgage that was taken out on this home.
Original Mortgage
$9,500
Interest Rate
3.38%
Mortgage Type
New Conventional
Purchase Details
Closed on
Oct 23, 2012
Sold by
Ridenour Alyssa Diane
Bought by
S & D Properties
Purchase Details
Closed on
Feb 16, 2012
Sold by
Ridenour Patricia Lynn
Bought by
Ridenour Alyssa Diane
Create a Home Valuation Report for This Property
The Home Valuation Report is an in-depth analysis detailing your home's value as well as a comparison with similar homes in the area
Home Values in the Area
Average Home Value in this Area
Purchase History
| Date | Buyer | Sale Price | Title Company |
|---|---|---|---|
| Dela Cruz Martinez Juan | -- | None Available | |
| Romano Simon M | -- | None Available | |
| S And D Properties | $9,500 | None Available | |
| Agustin Sandra Margarita | -- | None Available | |
| S & D Properties | -- | Red River Title Co | |
| Ridenour Alyssa Diane | -- | None Available |
Source: Public Records
Mortgage History
| Date | Status | Borrower | Loan Amount |
|---|---|---|---|
| Previous Owner | Romano Simon M | $5,600 | |
| Previous Owner | Agustin Sandra Margarita | $9,500 |
Source: Public Records
Tax History Compared to Growth
Tax History
| Year | Tax Paid | Tax Assessment Tax Assessment Total Assessment is a certain percentage of the fair market value that is determined by local assessors to be the total taxable value of land and additions on the property. | Land | Improvement |
|---|---|---|---|---|
| 2025 | $2,966 | $117,566 | $40,800 | $76,766 |
| 2024 | $2,966 | $127,653 | $52,500 | $75,153 |
| 2023 | $2,518 | $111,144 | $31,500 | $79,644 |
| 2022 | $2,459 | $103,497 | $31,500 | $71,997 |
| 2021 | $1,940 | $76,906 | $16,200 | $60,706 |
| 2020 | $2,102 | $79,671 | $13,500 | $66,171 |
| 2019 | $2,083 | $75,707 | $8,160 | $67,547 |
| 2018 | $1,864 | $67,175 | $6,960 | $60,215 |
| 2017 | $1,505 | $53,802 | $2,880 | $50,922 |
| 2016 | $328 | $11,725 | $2,700 | $9,025 |
| 2015 | $284 | $10,066 | $3,240 | $6,826 |
| 2014 | $284 | $10,066 | $3,240 | $6,826 |
Source: Public Records
Map
Nearby Homes
- 920 W Morgan St
- 1027 W Crawford St
- 831 W Owing St
- 826 W Crawford St
- 1120 W Owing St
- 1109 W Crawford St
- 1127 W Morgan St
- 1223 W Owing St
- TBD W Main St
- 904 W Shepherd St
- 1131 W Shepherd St
- 830 W Shepherd St
- 1217 W Nelson St
- 1221 W Crawford St
- 705 W Crawford St
- 919 W Day St
- 1224 W Nelson St
- 501 S Eddy Ave
- 1319 W Morgan St
- 1326 W Crawford St
- 1012 W Owing St
- 1022 W Owing St
- 1006 W Owings St
- 1006 W Owing St
- 400 S Tone Ave
- 408 S Tone Ave
- 613 W Owings St
- TBD W Owings St
- 1223 W Owings St
- 1017 W Morgan St
- 1015 W Morgan St
- 1023 W Morgan St
- 1007 W Morgan St
- 1027 W Morgan St
- 407 S Chandler Ave
- 1005 W Morgan St
- 1031 W Morgan St
- 401 S Chandler Ave
- 409 N Chandler Ave
- 1001 W Morgan St