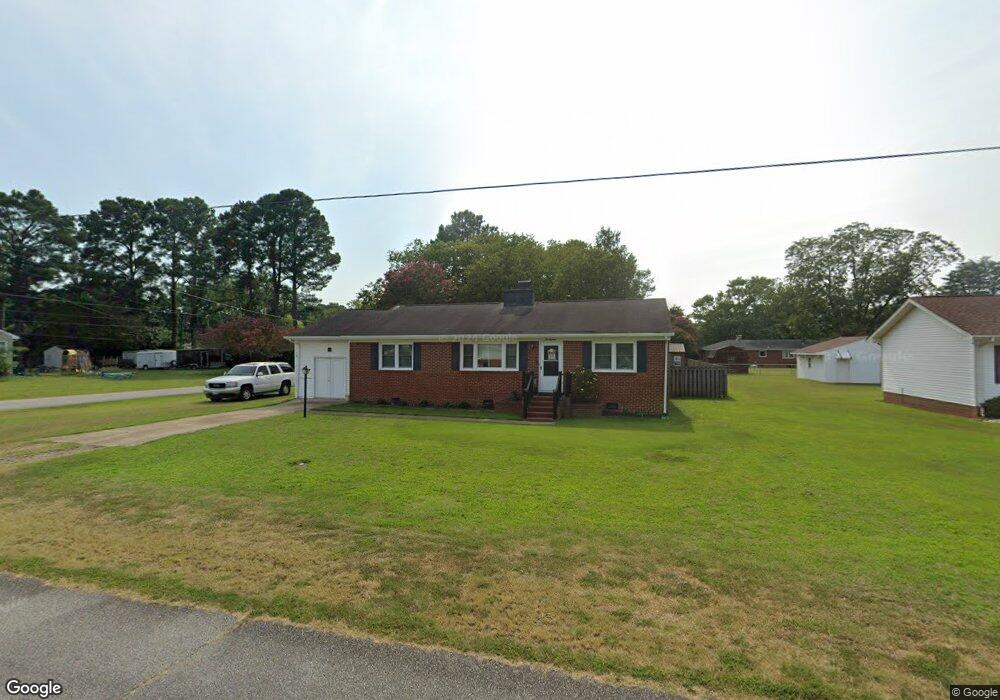
1018 Wilson Rd Smithfield, VA 23430
Estimated Value: $340,862 - $470,000
3
Beds
2
Baths
1,426
Sq Ft
$263/Sq Ft
Est. Value
About This Home
This home is located at 1018 Wilson Rd, Smithfield, VA 23430 and is currently estimated at $375,216, approximately $263 per square foot. 1018 Wilson Rd is a home located in Isle of Wight County with nearby schools including Hardy Elementary School, Smithfield Middle School, and Smithfield High School.
Ownership History
Date
Name
Owned For
Owner Type
Purchase Details
Closed on
Sep 15, 2020
Sold by
Roman Fligiel Andrew
Bought by
Fligiel Andrew Roman and Fligiel Ashley Irene
Current Estimated Value
Home Financials for this Owner
Home Financials are based on the most recent Mortgage that was taken out on this home.
Original Mortgage
$202,632
Outstanding Balance
$177,374
Interest Rate
2.9%
Mortgage Type
FHA
Estimated Equity
$197,842
Purchase Details
Closed on
Jun 8, 2018
Sold by
Parks Meredith S and Parks Stuart B
Bought by
Fligel Andrew R and Eggleston Ashley I
Home Financials for this Owner
Home Financials are based on the most recent Mortgage that was taken out on this home.
Original Mortgage
$206,043
Interest Rate
4.62%
Mortgage Type
FHA
Purchase Details
Closed on
Dec 8, 2014
Purchase Details
Closed on
Sep 24, 2009
Sold by
Woolman Charles G and Woolman Linda M
Purchase Details
Closed on
Mar 12, 1993
Purchase Details
Closed on
Oct 18, 1976
Create a Home Valuation Report for This Property
The Home Valuation Report is an in-depth analysis detailing your home's value as well as a comparison with similar homes in the area
Home Values in the Area
Average Home Value in this Area
Purchase History
| Date | Buyer | Sale Price | Title Company |
|---|---|---|---|
| Fligiel Andrew Roman | -- | Rosenberg Lpa | |
| Fligel Andrew R | $227,500 | -- | |
| -- | $185,000 | -- | |
| -- | $90,000 | -- | |
| -- | -- | -- | |
| -- | $35,000 | -- |
Source: Public Records
Mortgage History
| Date | Status | Borrower | Loan Amount |
|---|---|---|---|
| Open | Fligiel Andrew Roman | $202,632 | |
| Previous Owner | Fligel Andrew R | $206,043 |
Source: Public Records
Tax History Compared to Growth
Tax History
| Year | Tax Paid | Tax Assessment Tax Assessment Total Assessment is a certain percentage of the fair market value that is determined by local assessors to be the total taxable value of land and additions on the property. | Land | Improvement |
|---|---|---|---|---|
| 2025 | $2,229 | $287,600 | $50,000 | $237,600 |
| 2024 | $2,099 | $287,600 | $50,000 | $237,600 |
| 2023 | $2,096 | $287,600 | $50,000 | $237,600 |
| 2022 | $1,986 | $227,300 | $50,000 | $177,300 |
| 2021 | $1,986 | $227,300 | $50,000 | $177,300 |
| 2020 | $1,986 | $227,300 | $50,000 | $177,300 |
| 2019 | $1,986 | $227,300 | $50,000 | $177,300 |
| 2018 | $1,591 | $180,800 | $50,000 | $130,800 |
| 2016 | $1,609 | $180,800 | $50,000 | $130,800 |
| 2015 | $1,622 | $180,800 | $50,000 | $130,800 |
| 2014 | $1,622 | $182,300 | $50,000 | $132,300 |
| 2013 | -- | $182,300 | $50,000 | $132,300 |
Source: Public Records
Map
Nearby Homes
- 928 Pocahontas Ct
- 901 S Church St
- 728 W Andrews Crossing
- 200 Oxford Ave Unit 46-2
- 202 Oxford Ave Unit 46-1
- Newport w/ Loft - Villa Home, Church Square Plan at Church Square
- Augusta - Villa Home, Church Square Plan at Church Square
- Windsor - Villa Home, Church Square Plan at Church Square
- Newport - Villa Home, Church Square Plan at Church Square
- Augusta w/ Loft Level - Villa Home, Church Square Plan at Church Square
- 210 Oxford Ave Unit 47-1
- 812 S Church St
- 104 Cathedral St Unit 39-1
- 200 Durham St
- 204 Cathedral St
- 804 S Church St
- 202 Saint Paul's Ave Unit 29-2
- 224 St Pauls Ave
- 224 Saint Paul's Ave Unit 32-3
- 800 S Church St
- 1010 Wilson Rd
- 1010 Wilson Rd
- 1100 Wilson Rd
- 1013 Magruder Rd
- 1008 Wilson Rd
- 1017 Wilson Rd
- 1011 Magruder Rd
- 1101 Magruder Rd
- 1101 Wilson Rd
- 1015 Wilson Rd
- 1102 Wilson Rd
- 1009 Magruder Rd
- 1103 Magruder Rd
- 1013 Wilson Rd
- 1006 Wilson Rd
- 1104 Wilson Rd
- 1105 Wilson Rd
- 1007 Magruder Rd
- 1105 Magruder Rd
- 1010 Magruder Rd