
Landlord's Agent in 2019
Erika Ricardo
Netgar Investments Inc
(847) 849-0067
2 in this area
158 Total Sales


Estimated Value: $197,000 - $234,000
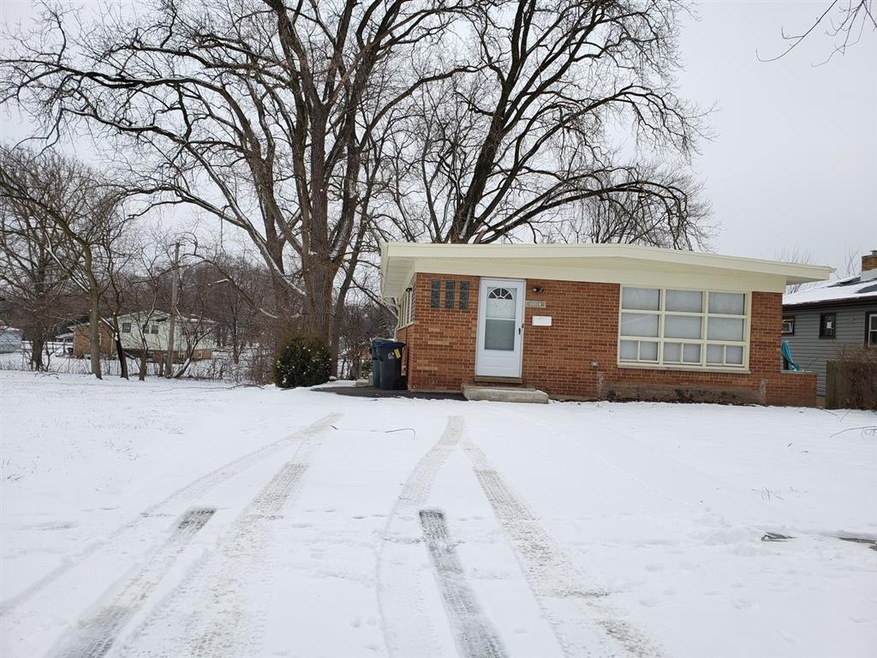
This home is located at 1018 Yeoman St, Waukegan, IL 60085 since 14 January 2019 and is currently priced at $213,357. This property was built in 1953. 1018 Yeoman St is a home located in Lake County with nearby schools including Whittier Elementary School, Edith M Smith Middle School, and Waukegan High School.
Last Agent to Rent the Property
Netgar Investments Inc License #471019403 Listed on: 01/14/2019
| Date | Buyer | Sale Price | Title Company |
|---|---|---|---|
| Full Contact Properties Llc | -- | None Available | |
| Robinson Edward P | -- | -- |
| Date | Status | Borrower | Loan Amount |
|---|---|---|---|
| Previous Owner | Robinson Edward P | $35,000 |
| Date | Event | Price | List to Sale | Price per Sq Ft | Prior Sale |
|---|---|---|---|---|---|
| 01/22/2019 01/22/19 | Rented | $1,040 | -5.5% | -- | |
| 01/17/2019 01/17/19 | For Rent | $1,100 | 0.0% | -- | |
| 01/16/2019 01/16/19 | Under Contract | -- | -- | -- | |
| 01/14/2019 01/14/19 | For Rent | $1,100 | 0.0% | -- | |
| 02/15/2018 02/15/18 | Sold | $55,500 | +11.0% | $51 / Sq Ft | View Prior Sale |
| 01/17/2018 01/17/18 | Pending | -- | -- | -- | |
| 01/13/2018 01/13/18 | For Sale | $50,000 | -- | $46 / Sq Ft |
| Year | Tax Paid | Tax Assessment Tax Assessment Total Assessment is a certain percentage of the fair market value that is determined by local assessors to be the total taxable value of land and additions on the property. | Land | Improvement |
|---|---|---|---|---|
| 2024 | $4,315 | $50,618 | $8,162 | $42,456 |
| 2023 | $4,315 | $45,765 | $7,379 | $38,386 |
| 2022 | $4,175 | $42,702 | $5,639 | $37,063 |
| 2021 | $3,659 | $35,094 | $4,930 | $30,164 |
| 2020 | $3,706 | $32,694 | $4,593 | $28,101 |
| 2019 | $3,730 | $29,959 | $4,209 | $25,750 |
| 2018 | $1,723 | $25,553 | $5,295 | $20,258 |
| 2017 | $2,959 | $26,649 | $4,685 | $21,964 |
| 2016 | $2,109 | $19,646 | $4,071 | $15,575 |
| 2015 | $1,957 | $17,584 | $3,644 | $13,940 |
| 2014 | $2,678 | $21,368 | $3,068 | $18,300 |
| 2012 | $3,539 | $23,150 | $3,323 | $19,827 |
Landlord's Agent in 2019
Erika Ricardo
Netgar Investments Inc
(847) 849-0067
2 in this area
158 Total Sales
Seller's Agent in 2018
Venetia O'Malley
Century 21 Circle
(847) 370-0898
74 Total Sales
Source: Midwest Real Estate Data (MRED)
MLS Number: MRD10249019
APN: 08-17-410-018
Disclaimer: Certain information contained herein is derived from information provided by parties other than Homes.com. All information provided is deemed reliable, but is not guaranteed to be accurate and should be independently verified.
![]() Based on information submitted to the MLS GRID. All data is obtained from various sources and may not have been verified by broker or MLS GRID. Supplied Open House Information is subject to change without notice. All information should be independently reviewed and verified for accuracy. Properties may or may not be listed by the office/agent presenting the information. Some IDX listings have been excluded from this website.
Based on information submitted to the MLS GRID. All data is obtained from various sources and may not have been verified by broker or MLS GRID. Supplied Open House Information is subject to change without notice. All information should be independently reviewed and verified for accuracy. Properties may or may not be listed by the office/agent presenting the information. Some IDX listings have been excluded from this website.
The Digital Millennium Copyright Act of 1998, 17 U.S.C. § 512 (the “DMCA”) provides recourse for copyright owners who believe that material appearing on the Internet infringes their rights under U.S. copyright law. If you believe in good faith that any content or material made available in connection with our website or services infringes your copyright, you (or your agent) may send us a notice requesting that the content or material be removed, or access to it blocked.
Notices must be sent in writing by email to DMCAnotice@MLSGrid.com.
The DMCA requires that your notice of alleged copyright infringement include the following information:
(1) description of the copyrighted work that is the subject of claimed infringement;
(2) description of the alleged infringing content and information sufficient to permit us to locate the content;
(3) contact information for you, including your address, telephone number and email address;
(4) a statement by you that you have a good faith belief that the content in the manner complained of is not authorized by the copyright owner, or its agent, or by the operation of any law;
(5) a statement by you, signed under penalty of perjury, that the information in the notification is accurate and that you have the authority to enforce the copyrights that are claimed to be infringed; and
(6) a physical or electronic signature of the copyright owner or a person authorized to act on the copyright owner’s behalf. Failure to include all of the above information may result in the delay of the processing of your complaint.