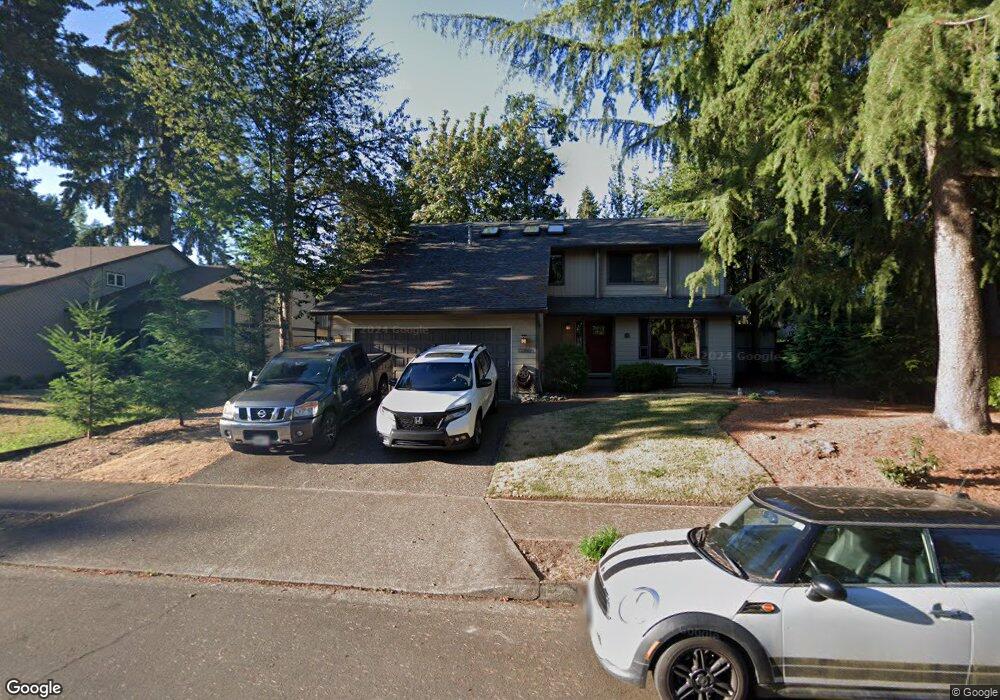
10180 SW Chickasaw Ct Tualatin, OR 97062
Estimated Value: $618,328 - $680,000
4
Beds
3
Baths
2,152
Sq Ft
$298/Sq Ft
Est. Value
About This Home
This home is located at 10180 SW Chickasaw Ct, Tualatin, OR 97062 and is currently estimated at $640,832, approximately $297 per square foot. 10180 SW Chickasaw Ct is a home located in Washington County with nearby schools including Tualatin Elementary School, Hazelbrook Middle School, and Tualatin High School.
Ownership History
Date
Name
Owned For
Owner Type
Purchase Details
Closed on
Dec 14, 2012
Sold by
Federal National Mortgage Association
Bought by
Gorbett Hal M and Gorbett Noelle
Current Estimated Value
Home Financials for this Owner
Home Financials are based on the most recent Mortgage that was taken out on this home.
Original Mortgage
$289,136
Outstanding Balance
$200,135
Interest Rate
3.35%
Mortgage Type
VA
Estimated Equity
$440,697
Purchase Details
Closed on
Mar 9, 2012
Sold by
Kim Gyeong Rok
Bought by
Federal National Mortgage Association
Purchase Details
Closed on
Nov 4, 2005
Sold by
Kim Gyeong Rok
Bought by
Kim Gyeong Rok and Kim Yoon Hi
Purchase Details
Closed on
Dec 28, 2004
Sold by
Crosa Jorge H and Crosa Lidia M
Bought by
Kim Gyeong Rok
Home Financials for this Owner
Home Financials are based on the most recent Mortgage that was taken out on this home.
Original Mortgage
$211,900
Interest Rate
5.74%
Mortgage Type
Unknown
Create a Home Valuation Report for This Property
The Home Valuation Report is an in-depth analysis detailing your home's value as well as a comparison with similar homes in the area
Home Values in the Area
Average Home Value in this Area
Purchase History
| Date | Buyer | Sale Price | Title Company |
|---|---|---|---|
| Gorbett Hal M | $279,900 | Nextitle | |
| Federal National Mortgage Association | $169,206 | Nextitle | |
| Kim Gyeong Rok | -- | -- | |
| Kim Gyeong Rok | $265,000 | Fidelity Natl Title Co Of Or |
Source: Public Records
Mortgage History
| Date | Status | Borrower | Loan Amount |
|---|---|---|---|
| Open | Gorbett Hal M | $289,136 | |
| Previous Owner | Kim Gyeong Rok | $211,900 | |
| Closed | Kim Gyeong Rok | $26,500 |
Source: Public Records
Tax History Compared to Growth
Tax History
| Year | Tax Paid | Tax Assessment Tax Assessment Total Assessment is a certain percentage of the fair market value that is determined by local assessors to be the total taxable value of land and additions on the property. | Land | Improvement |
|---|---|---|---|---|
| 2025 | $5,993 | $352,380 | -- | -- |
| 2024 | $5,837 | $342,120 | -- | -- |
| 2023 | $5,837 | $332,160 | $0 | $0 |
| 2022 | $5,584 | $332,160 | $0 | $0 |
| 2021 | $5,448 | $313,100 | $0 | $0 |
| 2020 | $5,286 | $303,990 | $0 | $0 |
| 2019 | $5,144 | $295,140 | $0 | $0 |
| 2018 | $4,936 | $286,550 | $0 | $0 |
| 2017 | $4,647 | $278,210 | $0 | $0 |
| 2016 | $4,431 | $270,110 | $0 | $0 |
| 2015 | $4,161 | $262,250 | $0 | $0 |
| 2014 | $3,973 | $254,620 | $0 | $0 |
Source: Public Records
Map
Nearby Homes
- 20900 SW Winema Dr
- 20752 SW 104th Ave
- 20515 SW 104th Ave
- 20575 SW Kawanda Ct
- 9995 SW Siuslaw Ln
- 9495 SW Cherry Ln
- 9411 SW Nez Perce Ct
- 8833 Chokecherry Ln
- 8854 SW Vermillion Dr
- 8834 SW Vermillion Dr
- 8874 SW Vermillion Dr
- 10220 SW Paulina Dr
- 20025 SW 94th Place
- 20340 SW 93rd Ave
- 9433 SW Siuslaw Ln
- 9142 SW Raritan Ct
- 20258 SW 93rd Ave
- 20685 SW Siletz Ct
- 20916 SW Siletz Ct
- 21689 SW Klickitat Ct
- 10176 SW Chickasaw Ct
- 20684 SW Teton Ave
- 10185 SW Siletz Dr
- 10197 SW Siletz Dr
- 10148 SW Chickasaw Ct
- 10173 SW Siletz Dr
- 10183 SW Chickasaw Ct
- 20636 SW Teton Ave
- 10171 SW Chickasaw Ct
- 10064 SW Chickasaw Ct
- 10159 SW Siletz Dr
- 10081 SW Chickasaw Ct
- 20590 SW Teton Ave
- 10106 SW Erie Ct
- 20701 SW Teton Ave
- 20665 SW Teton Ave
- 10032 SW Chickasaw Ct
- 10198 SW Siletz Dr
- 10097 SW Siletz Dr
- 10249 SW Siletz Dr