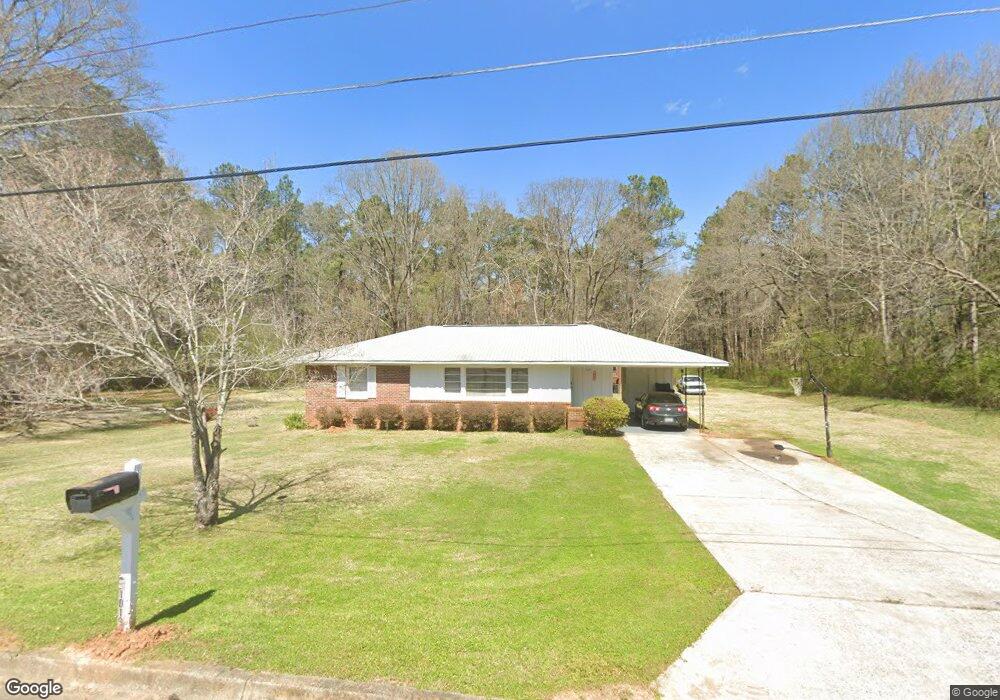
1019 Cleo St Cedartown, GA 30125
Estimated Value: $89,000 - $163,766
3
Beds
1
Bath
1,202
Sq Ft
$116/Sq Ft
Est. Value
About This Home
This home is located at 1019 Cleo St, Cedartown, GA 30125 and is currently estimated at $139,692, approximately $116 per square foot. 1019 Cleo St is a home located in Polk County with nearby schools including Cedar Christian School.
Ownership History
Date
Name
Owned For
Owner Type
Purchase Details
Closed on
Jan 24, 2013
Sold by
Simmons Carl Patrick
Bought by
Washington Larry and Frazier Jacqueline
Current Estimated Value
Home Financials for this Owner
Home Financials are based on the most recent Mortgage that was taken out on this home.
Original Mortgage
$39,275
Outstanding Balance
$28,497
Interest Rate
4.25%
Mortgage Type
FHA
Estimated Equity
$111,196
Purchase Details
Closed on
Dec 13, 1999
Sold by
Young Eva Bell
Bought by
Simmons Carl Patrick*
Purchase Details
Closed on
Jun 27, 1983
Sold by
Franklin Discount Co
Bought by
Young Paul and Young Eva
Purchase Details
Closed on
Feb 2, 1982
Sold by
Patrick James
Bought by
Franklin Discount Co
Purchase Details
Closed on
May 5, 1975
Sold by
Atkinson Curtis L
Bought by
Patrick James
Purchase Details
Closed on
Oct 10, 1968
Sold by
Atkinson Curtis
Bought by
Atkinson Curtis L
Purchase Details
Closed on
Jul 1, 1959
Bought by
Atkinson Curtis
Create a Home Valuation Report for This Property
The Home Valuation Report is an in-depth analysis detailing your home's value as well as a comparison with similar homes in the area
Home Values in the Area
Average Home Value in this Area
Purchase History
| Date | Buyer | Sale Price | Title Company |
|---|---|---|---|
| Washington Larry | $40,000 | -- | |
| Simmons Carl Patrick* | -- | -- | |
| Young Paul | -- | -- | |
| Franklin Discount Co | -- | -- | |
| Patrick James | -- | -- | |
| Atkinson Curtis L | -- | -- | |
| Atkinson Curtis | -- | -- |
Source: Public Records
Mortgage History
| Date | Status | Borrower | Loan Amount |
|---|---|---|---|
| Open | Washington Larry | $39,275 |
Source: Public Records
Tax History Compared to Growth
Tax History
| Year | Tax Paid | Tax Assessment Tax Assessment Total Assessment is a certain percentage of the fair market value that is determined by local assessors to be the total taxable value of land and additions on the property. | Land | Improvement |
|---|---|---|---|---|
| 2024 | $1,284 | $41,980 | $4,800 | $37,180 |
| 2023 | $808 | $24,674 | $1,254 | $23,420 |
| 2022 | $456 | $21,225 | $1,254 | $19,971 |
| 2021 | $462 | $21,225 | $1,254 | $19,971 |
| 2020 | $511 | $21,225 | $1,254 | $19,971 |
| 2019 | $432 | $16,100 | $1,917 | $14,183 |
| 2018 | $423 | $15,336 | $1,643 | $13,693 |
| 2017 | $417 | $15,336 | $1,643 | $13,693 |
| 2016 | $417 | $15,336 | $1,643 | $13,693 |
| 2015 | $420 | $15,375 | $1,643 | $13,732 |
| 2014 | $423 | $15,375 | $1,643 | $13,732 |
Source: Public Records
Map
Nearby Homes
- 1101 East Ave
- 10 Woodglen Dr
- 109 Perry St
- 00 Juliette St
- 537 Fletcher St
- 202 Ridgewood Rd
- 427 Park St
- 209 Ridgewood Rd
- 254 E Girard Ave
- 328 330 Stubbs
- 208 Highland Ave
- 618 Valley Rd
- 662 Hillside Dr
- 645 Valley Rd
- 217 E Gibson St
- 226 Central St
- 660 Valley Rd
- 129 Thompson St
- 328 Mountain Home Rd
- 601 Mountain Home Rd