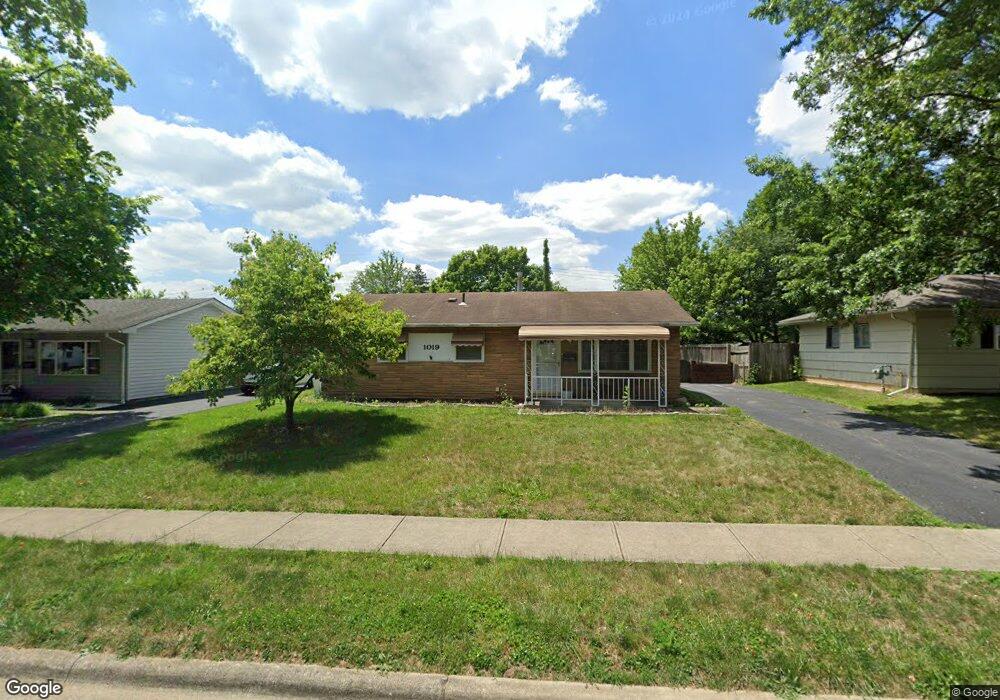
1019 Cottingham Rd Reynoldsburg, OH 43068
Estimated Value: $224,000 - $257,000
3
Beds
2
Baths
1,404
Sq Ft
$169/Sq Ft
Est. Value
About This Home
This home is located at 1019 Cottingham Rd, Reynoldsburg, OH 43068 and is currently estimated at $237,902, approximately $169 per square foot. 1019 Cottingham Rd is a home located in Franklin County with nearby schools including French Run Elementary School, Waggoner Road Elementary School, and Waggoner Road Junior High School.
Ownership History
Date
Name
Owned For
Owner Type
Purchase Details
Closed on
May 30, 2024
Sold by
Schrader Robert A
Bought by
A & A Bros Investments Llc
Current Estimated Value
Home Financials for this Owner
Home Financials are based on the most recent Mortgage that was taken out on this home.
Original Mortgage
$151,700
Outstanding Balance
$149,819
Interest Rate
7.17%
Mortgage Type
Construction
Estimated Equity
$88,083
Purchase Details
Closed on
May 17, 2024
Sold by
Schrader Robert A
Bought by
A & A Bros Investments Llc
Home Financials for this Owner
Home Financials are based on the most recent Mortgage that was taken out on this home.
Original Mortgage
$151,700
Outstanding Balance
$149,819
Interest Rate
7.17%
Mortgage Type
Construction
Estimated Equity
$88,083
Purchase Details
Closed on
Sep 10, 1999
Sold by
Estate Of Mary Juanita Schrader
Bought by
Schrader Robert A
Purchase Details
Closed on
Oct 12, 1990
Bought by
Schrader Mary J
Purchase Details
Closed on
Jul 30, 1990
Create a Home Valuation Report for This Property
The Home Valuation Report is an in-depth analysis detailing your home's value as well as a comparison with similar homes in the area
Home Values in the Area
Average Home Value in this Area
Purchase History
| Date | Buyer | Sale Price | Title Company |
|---|---|---|---|
| A & A Bros Investments Llc | $123,500 | Pm Title | |
| A & A Bros Investments Llc | $123,500 | Pm Title | |
| Schrader Robert A | -- | -- | |
| Schrader Mary J | -- | -- | |
| -- | -- | -- |
Source: Public Records
Mortgage History
| Date | Status | Borrower | Loan Amount |
|---|---|---|---|
| Open | A & A Bros Investments Llc | $151,700 | |
| Closed | A & A Bros Investments Llc | $151,700 |
Source: Public Records
Tax History Compared to Growth
Tax History
| Year | Tax Paid | Tax Assessment Tax Assessment Total Assessment is a certain percentage of the fair market value that is determined by local assessors to be the total taxable value of land and additions on the property. | Land | Improvement |
|---|---|---|---|---|
| 2024 | $3,604 | $70,390 | $18,060 | $52,330 |
| 2023 | $3,439 | $70,390 | $18,060 | $52,330 |
| 2022 | $2,390 | $37,000 | $6,410 | $30,590 |
| 2021 | $2,399 | $37,000 | $6,410 | $30,590 |
| 2020 | $2,448 | $37,000 | $6,410 | $30,590 |
| 2019 | $2,140 | $29,330 | $5,110 | $24,220 |
| 2018 | $2,150 | $29,330 | $5,110 | $24,220 |
| 2017 | $2,140 | $29,330 | $5,110 | $24,220 |
| 2016 | $2,228 | $27,300 | $5,250 | $22,050 |
| 2015 | $2,159 | $27,300 | $5,250 | $22,050 |
| 2014 | $2,169 | $27,300 | $5,250 | $22,050 |
| 2013 | $1,111 | $28,735 | $5,530 | $23,205 |
Source: Public Records
Map
Nearby Homes
- 7353 Wollam Ave
- 7358 Roshon Ave
- 1084 Northfield Place S
- 7357 Sabre Ave
- 7352 Saratoga Ave
- 7399 Marlan Ave
- 7238 Saratoga Ave
- 1350 Azalea Dr Unit 1350
- 7678 Felder Dr
- 1080 Briarcliff Rd
- 7487 E Main St
- 7727 Meisner Ct
- 7150 E Main St Unit B101
- Mendelssohn with Finished Lower Level Plan at Wilson Ridge
- Schubert with Finished Lower Level Plan at Wilson Ridge
- 857 Promise Ct
- 847 Promise Ct
- 6930 Tanya Terrace
- 144 Cambridge Ct
- 7682 E Main St
- 1029 Cottingham Rd
- 1013 Cottingham Rd
- 1006 Pleasant Ct
- 1037 Cottingham Rd
- 1001 Cottingham Rd
- 1009 Pleasant Ct
- 1018 Cottingham Rd
- 1026 Cottingham Rd
- 996 Pleasant Dr
- 990 Pleasant Dr
- 1034 Cottingham Rd
- 1010 Cottingham Rd
- 1000 Pleasant Ct
- 1042 Cottingham Rd
- 1002 Cottingham Rd
- 984 Pleasant Dr
- 1011 Pleasant Ct
- 1055 Cottingham Rd
- 1050 Cottingham Rd
- 1031 Hillridge Rd