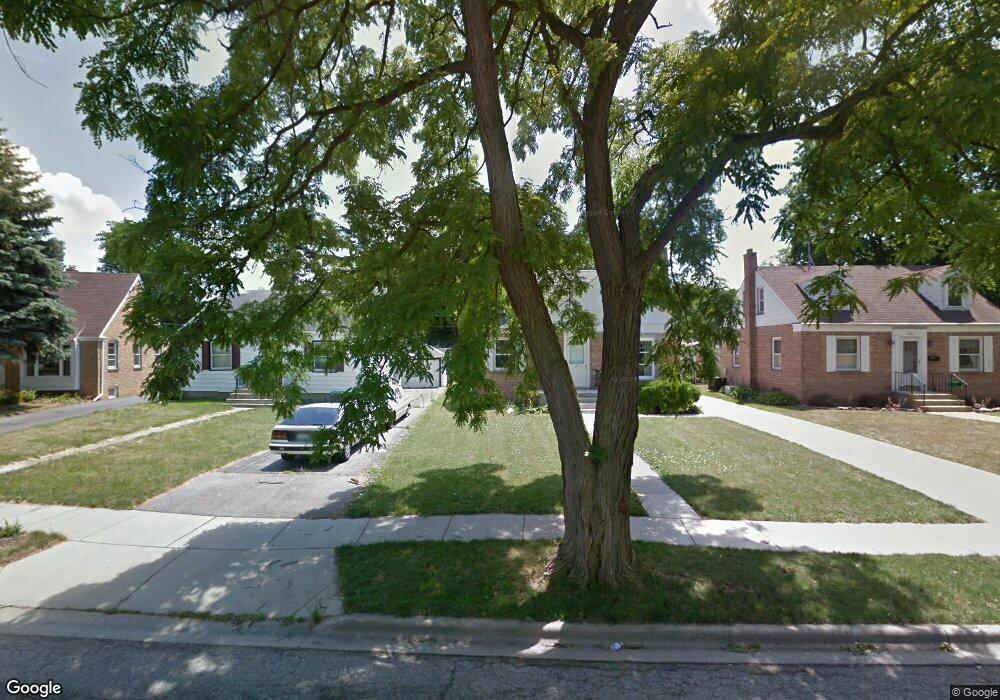
1019 Fairfield Ct Waukegan, IL 60085
Estimated Value: $225,814 - $235,000
3
Beds
2
Baths
1,376
Sq Ft
$167/Sq Ft
Est. Value
About This Home
This home is located at 1019 Fairfield Ct, Waukegan, IL 60085 and is currently estimated at $229,204, approximately $166 per square foot. 1019 Fairfield Ct is a home located in Lake County with nearby schools including Glen Flora Elementary School, Edith M Smith Middle School, and Waukegan High School.
Ownership History
Date
Name
Owned For
Owner Type
Purchase Details
Closed on
Aug 11, 2017
Sold by
Lovering Christopher M
Bought by
General Properties Llc
Current Estimated Value
Purchase Details
Closed on
Feb 8, 2011
Sold by
Fannie Mae
Bought by
Lovering Christopher M
Purchase Details
Closed on
Mar 24, 2010
Sold by
Martinez Osiris and Jpmorgan Chase Bank National A
Bought by
Jpmorgan Chase Bank National Association
Purchase Details
Closed on
Dec 29, 2003
Sold by
Bakshis Lawrence J
Bought by
Martinez Osiris
Home Financials for this Owner
Home Financials are based on the most recent Mortgage that was taken out on this home.
Original Mortgage
$130,950
Interest Rate
5.96%
Mortgage Type
Purchase Money Mortgage
Purchase Details
Closed on
Mar 1, 1994
Sold by
Townsend Rhonda L and Bakshis Rhonda L
Bought by
Bakshis Lawrence J
Create a Home Valuation Report for This Property
The Home Valuation Report is an in-depth analysis detailing your home's value as well as a comparison with similar homes in the area
Home Values in the Area
Average Home Value in this Area
Purchase History
| Date | Buyer | Sale Price | Title Company |
|---|---|---|---|
| General Properties Llc | -- | None Available | |
| Lovering Christopher M | $32,500 | Central Illinois Title Co | |
| Jpmorgan Chase Bank National Association | $136,934 | None Available | |
| Martinez Osiris | $135,000 | Ticor Title Insurance Co | |
| Bakshis Lawrence J | -- | -- |
Source: Public Records
Mortgage History
| Date | Status | Borrower | Loan Amount |
|---|---|---|---|
| Previous Owner | Martinez Osiris | $130,950 |
Source: Public Records
Tax History Compared to Growth
Tax History
| Year | Tax Paid | Tax Assessment Tax Assessment Total Assessment is a certain percentage of the fair market value that is determined by local assessors to be the total taxable value of land and additions on the property. | Land | Improvement |
|---|---|---|---|---|
| 2024 | $5,006 | $58,936 | $9,468 | $49,468 |
| 2023 | $5,186 | $53,089 | $8,476 | $44,613 |
| 2022 | $5,186 | $53,043 | $7,332 | $45,711 |
| 2021 | $4,743 | $45,489 | $6,540 | $38,949 |
| 2020 | $4,804 | $42,379 | $6,093 | $36,286 |
| 2019 | $4,835 | $38,833 | $5,583 | $33,250 |
| 2018 | $4,891 | $37,831 | $7,113 | $30,718 |
| 2017 | $4,797 | $33,470 | $6,293 | $27,177 |
| 2016 | $4,494 | $29,084 | $5,468 | $23,616 |
| 2015 | $4,397 | $26,031 | $4,894 | $21,137 |
| 2014 | $3,527 | $20,849 | $4,907 | $15,942 |
| 2012 | $4,371 | $22,586 | $5,315 | $17,271 |
Source: Public Records
Map
Nearby Homes
- 917 N Linden Ave
- 1105 Woodlawn Cir
- 1000 Pine St
- 918 N Ash St
- 1110 N Ash St
- 1122 N Ash St
- 824 N Butrick St
- 1335 Chestnut St
- 1504 W Glen Flora Ave
- 1336 N Ash St
- 620 N Poplar St
- 1117 Judge Ave
- 968 Judge Ave
- 702 Franklin St
- 522 N Poplar St
- 415 W Ridgeland Ave
- 1038 Indiana Ave
- 511 Chestnut St
- 428 N Poplar St
- 509 N Butrick St
- 1023 Fairfield Ct
- 1015 Fairfield Ct
- 1011 Fairfield Ct
- 1014 W Ridgeland Ave
- 1020 W Ridgeland Ave
- 1007 W Fairfield Ct
- 1101 Fairfield Cir
- 1010 W Ridgeland Ave
- 1007 Fairfield Ct
- 1006 W Ridgeland Ave
- 1020 Fairfield Ct
- 1024 Fairfield Ct
- 1016 Fairfield Ct
- 1102 W Ridgeland Ave
- 1005 Fairfield Ct
- 1105 Fairfield Cir
- 928 W Ridgeland Ave
- 1012 Fairfield Ct
- 1006 W Fairfield Ct
- 1006 Fairfield Ct