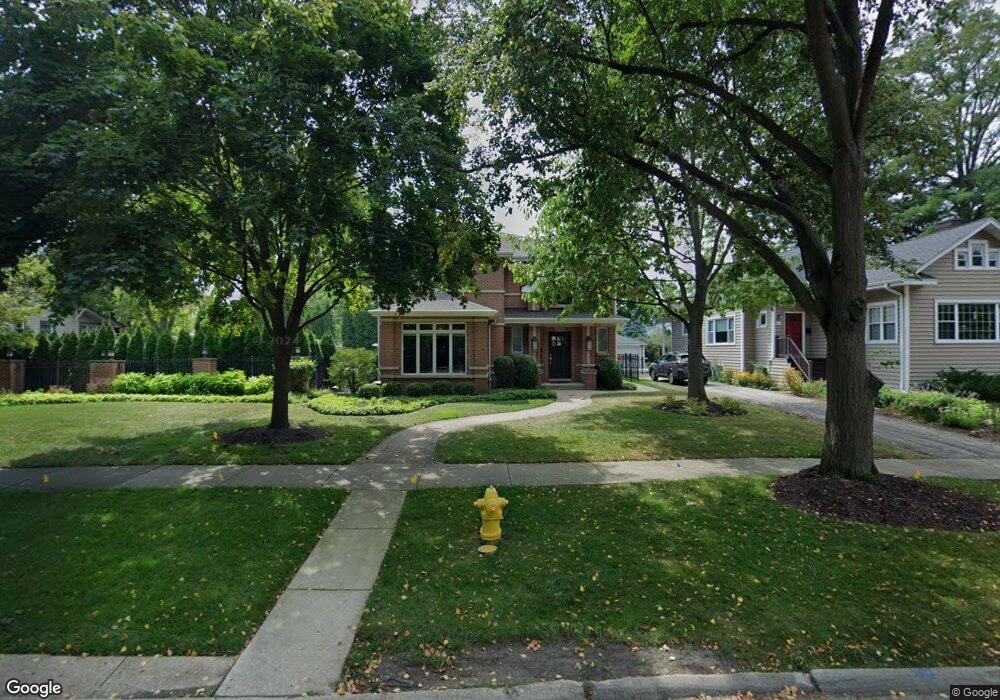
1019 Garden St Park Ridge, IL 60068
Estimated Value: $788,000 - $1,202,000
3
Beds
3
Baths
2,364
Sq Ft
$403/Sq Ft
Est. Value
About This Home
This home is located at 1019 Garden St, Park Ridge, IL 60068 and is currently estimated at $951,814, approximately $402 per square foot. 1019 Garden St is a home located in Cook County with nearby schools including George Washington Elementary School, Lincoln Middle School, and Maine South High School.
Ownership History
Date
Name
Owned For
Owner Type
Purchase Details
Closed on
Apr 6, 2001
Sold by
Sugrue Builders Inc
Bought by
Francque James A and Francque Cynthia
Current Estimated Value
Home Financials for this Owner
Home Financials are based on the most recent Mortgage that was taken out on this home.
Original Mortgage
$370,000
Outstanding Balance
$135,685
Interest Rate
6.95%
Estimated Equity
$816,129
Purchase Details
Closed on
May 31, 2000
Sold by
O & S Builders Llc
Bought by
Sugrue Builders Llc
Home Financials for this Owner
Home Financials are based on the most recent Mortgage that was taken out on this home.
Original Mortgage
$465,000
Interest Rate
7.03%
Purchase Details
Closed on
Oct 29, 1999
Sold by
Bognar James J
Bought by
C & S Builders Llc
Home Financials for this Owner
Home Financials are based on the most recent Mortgage that was taken out on this home.
Original Mortgage
$200,000
Interest Rate
7.78%
Create a Home Valuation Report for This Property
The Home Valuation Report is an in-depth analysis detailing your home's value as well as a comparison with similar homes in the area
Home Values in the Area
Average Home Value in this Area
Purchase History
| Date | Buyer | Sale Price | Title Company |
|---|---|---|---|
| Francque James A | $667,000 | -- | |
| Sugrue Builders Llc | -- | -- | |
| C & S Builders Llc | $250,000 | -- |
Source: Public Records
Mortgage History
| Date | Status | Borrower | Loan Amount |
|---|---|---|---|
| Open | Francque James A | $370,000 | |
| Previous Owner | Sugrue Builders Llc | $465,000 | |
| Previous Owner | C & S Builders Llc | $200,000 |
Source: Public Records
Tax History Compared to Growth
Tax History
| Year | Tax Paid | Tax Assessment Tax Assessment Total Assessment is a certain percentage of the fair market value that is determined by local assessors to be the total taxable value of land and additions on the property. | Land | Improvement |
|---|---|---|---|---|
| 2024 | $16,098 | $62,631 | $12,750 | $49,881 |
| 2023 | $15,398 | $62,631 | $12,750 | $49,881 |
| 2022 | $15,398 | $62,631 | $12,750 | $49,881 |
| 2021 | $16,614 | $57,957 | $7,875 | $50,082 |
| 2020 | $16,022 | $57,957 | $7,875 | $50,082 |
| 2019 | $15,706 | $63,689 | $7,875 | $55,814 |
| 2018 | $17,429 | $64,341 | $6,750 | $57,591 |
| 2017 | $17,372 | $64,341 | $6,750 | $57,591 |
| 2016 | $16,969 | $64,341 | $6,750 | $57,591 |
| 2015 | $17,276 | $58,638 | $5,625 | $53,013 |
| 2014 | $16,952 | $58,638 | $5,625 | $53,013 |
| 2013 | $16,040 | $58,638 | $5,625 | $53,013 |
Source: Public Records
Map
Nearby Homes
- 103 N Clifton Ave
- 1301 W Touhy Ave Unit 315
- 316 S Fairview Ave
- 428 S Clifton Ave
- 301 S Prospect Ave
- 170 N Northwest Hwy Unit 410
- 170 N Northwest Hwy Unit 407
- 1210 Elm St
- 1228 Elm St
- 812 Elm St
- 300 Meacham Ave
- 421 Leonard St
- 445 N Northwest Hwy
- 249 S Vine Ave Unit B
- 623 S Prospect Ave
- 829 Hastings St
- 320 Grant Place
- 516 Engel Blvd
- 425 W Talcott Rd
- 408 N Seminary Ave
- 1023 Garden St
- 1015 Garden St
- 1027 Garden St
- 1011 Garden St
- 1029 Garden St
- 1007 Garden St
- 112 S Clifton Ave
- 119 S Chester Ave
- 116 S Clifton Ave
- 100 S Clifton Ave
- 123 S Chester Ave
- 1018 Garden St
- 1022 Garden St
- 1012 Garden St
- 122 S Clifton Ave
- 1026 Garden St
- 1008 Garden St
- 125 S Chester Ave
- 27 S Chester Ave
- 124 S Clifton Ave