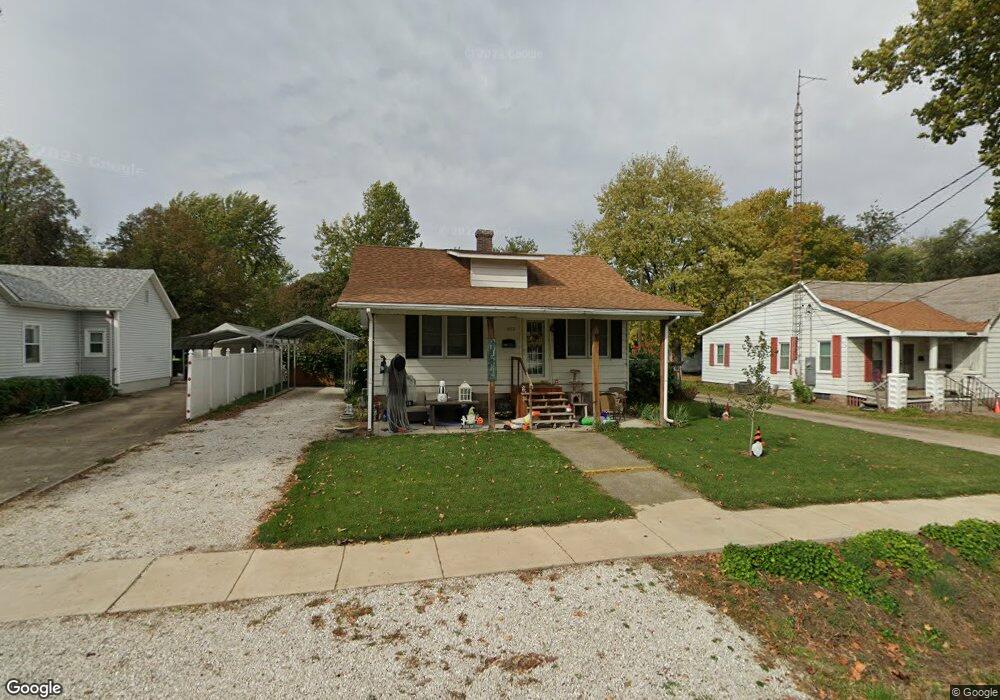
1019 N Diamond St Unit A Jacksonville, IL 62650
Estimated Value: $123,000 - $182,061
--
Bed
--
Bath
1,144
Sq Ft
$130/Sq Ft
Est. Value
About This Home
This home is located at 1019 N Diamond St Unit A, Jacksonville, IL 62650 and is currently estimated at $148,265, approximately $129 per square foot. 1019 N Diamond St Unit A is a home located in Morgan County with nearby schools including Jacksonville High School, Salem Lutheran School, and Salem Lutheran School.
Ownership History
Date
Name
Owned For
Owner Type
Purchase Details
Closed on
Sep 18, 2013
Sold by
The Secretary Of Hud
Bought by
Cox Ronald E and Cox Susan K
Current Estimated Value
Purchase Details
Closed on
May 5, 2013
Sold by
Brainerd Alan and Brainerd Darlene
Bought by
The Secretary Of Hud
Purchase Details
Closed on
Oct 31, 2005
Sold by
Parker Frances A
Bought by
Brainerd Alan and Brainerd Darlene
Home Financials for this Owner
Home Financials are based on the most recent Mortgage that was taken out on this home.
Original Mortgage
$80,750
Interest Rate
11.75%
Mortgage Type
Adjustable Rate Mortgage/ARM
Purchase Details
Closed on
Jul 28, 2005
Sold by
Poole Robert E and Wiseman Sue E
Bought by
Parker Frances A
Home Financials for this Owner
Home Financials are based on the most recent Mortgage that was taken out on this home.
Original Mortgage
$88,500
Interest Rate
5.69%
Mortgage Type
Purchase Money Mortgage
Create a Home Valuation Report for This Property
The Home Valuation Report is an in-depth analysis detailing your home's value as well as a comparison with similar homes in the area
Home Values in the Area
Average Home Value in this Area
Purchase History
| Date | Buyer | Sale Price | Title Company |
|---|---|---|---|
| Cox Ronald E | -- | None Available | |
| The Secretary Of Hud | -- | None Available | |
| Brainerd Alan | $95,400 | None Available | |
| Parker Frances A | $88,500 | None Available |
Source: Public Records
Mortgage History
| Date | Status | Borrower | Loan Amount |
|---|---|---|---|
| Previous Owner | Brainerd Alan | $80,750 | |
| Previous Owner | Parker Frances A | $88,500 |
Source: Public Records
Tax History Compared to Growth
Tax History
| Year | Tax Paid | Tax Assessment Tax Assessment Total Assessment is a certain percentage of the fair market value that is determined by local assessors to be the total taxable value of land and additions on the property. | Land | Improvement |
|---|---|---|---|---|
| 2024 | $2,823 | $43,630 | $4,400 | $39,230 |
| 2023 | $2,808 | $43,350 | $4,400 | $38,950 |
| 2022 | $2,811 | $40,500 | $4,400 | $36,100 |
| 2021 | $1,116 | $22,960 | $4,400 | $18,560 |
| 2020 | $1,162 | $22,960 | $4,400 | $18,560 |
| 2019 | $1,726 | $29,010 | $4,620 | $24,390 |
| 2018 | $1,641 | $29,010 | $4,620 | $24,390 |
| 2017 | $1,605 | $29,010 | $4,620 | $24,390 |
| 2016 | $1,614 | $28,920 | $3,350 | $25,570 |
| 2015 | $1,583 | $28,080 | $3,250 | $24,830 |
| 2014 | $1,583 | $28,080 | $3,250 | $24,830 |
| 2013 | $1,908 | $28,080 | $3,250 | $24,830 |
Source: Public Records
Map
Nearby Homes
- 754 Freedman St
- 858 N Diamond St
- 813 N Diamond St
- 840 W Walnut St
- 715 N Diamond St
- 6 Fernwood Blvd
- 615 W Lafayette Ave
- 500 N Diamond St
- 411 Caldwell St
- 706 W Douglas Ave
- 610 Sandusky St
- 735 W Douglas Ave
- 876 W State St
- 144 Caldwell St
- 314 W Douglas Ave
- 508 N Webster Ave
- 125 Westminster St
- 400 W Morgan St
- 1136 W State St
- 124 E Wolcott St
- 1019 N Diamond St
- 1015 N Diamond St
- 1031 N Diamond St
- 724 Freedman St
- 700 Freedman St
- 1039 N Diamond St
- 1005 N Diamond St
- 726 Freedman St
- 1043 N Diamond St
- 730 Freedman St
- 1014 N Diamond St
- 1049 N Diamond St
- 1012 N Diamond St
- 1016 N Diamond St
- 1010 N Diamond St
- 699 Freedman St
- 1018 N Diamond St
- 695 Freedman St
- 1006 N Diamond St
- 1040 N Diamond St