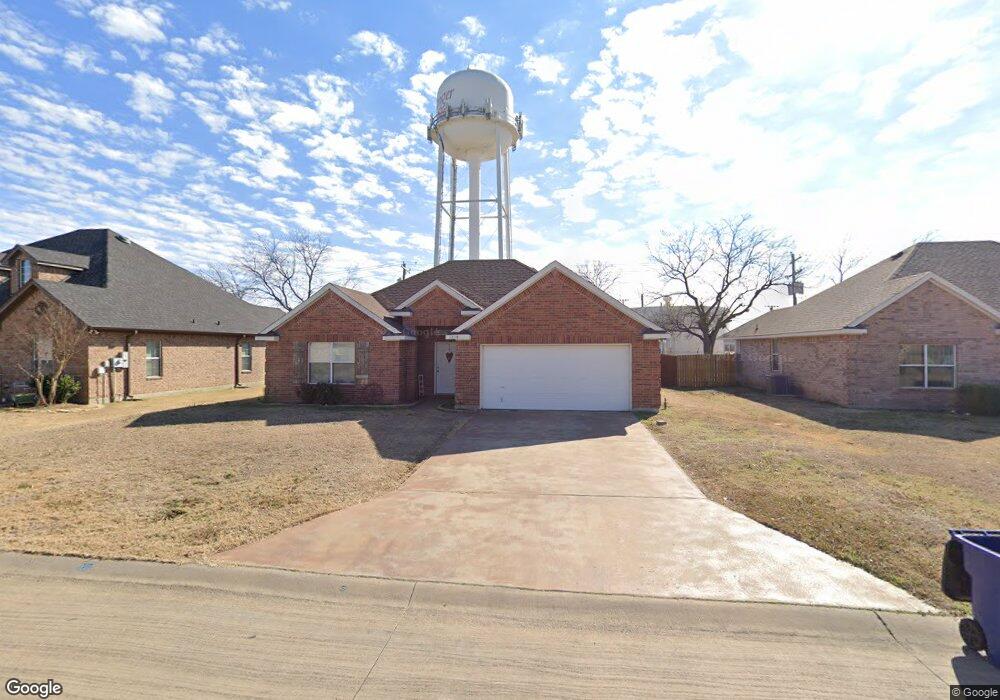
1019 Porter Place Sanger, TX 76266
Estimated Value: $271,164 - $317,000
3
Beds
2
Baths
1,364
Sq Ft
$217/Sq Ft
Est. Value
About This Home
This home is located at 1019 Porter Place, Sanger, TX 76266 and is currently estimated at $295,791, approximately $216 per square foot. 1019 Porter Place is a home located in Denton County with nearby schools including Chisholm Trail Elementary School, Clear Creek Intermediate School, and Sanger Middle School.
Ownership History
Date
Name
Owned For
Owner Type
Purchase Details
Closed on
Dec 13, 2016
Sold by
Skelton Steven and Clements Tami J
Bought by
Clements Skelton Company Llc
Current Estimated Value
Purchase Details
Closed on
May 9, 2014
Sold by
Skelton Steven P
Bought by
Skelton Steven and Clements Tami J
Home Financials for this Owner
Home Financials are based on the most recent Mortgage that was taken out on this home.
Original Mortgage
$95,250
Interest Rate
4.27%
Mortgage Type
New Conventional
Purchase Details
Closed on
May 10, 2005
Sold by
Wickwood Development Corp
Bought by
Skelton Steven P
Home Financials for this Owner
Home Financials are based on the most recent Mortgage that was taken out on this home.
Original Mortgage
$87,720
Interest Rate
6.03%
Mortgage Type
Fannie Mae Freddie Mac
Purchase Details
Closed on
Jun 23, 2004
Sold by
Hickory Creek Homes Lp
Bought by
Wickwood Development Corp
Home Financials for this Owner
Home Financials are based on the most recent Mortgage that was taken out on this home.
Original Mortgage
$93,000
Interest Rate
6.32%
Mortgage Type
Purchase Money Mortgage
Create a Home Valuation Report for This Property
The Home Valuation Report is an in-depth analysis detailing your home's value as well as a comparison with similar homes in the area
Home Values in the Area
Average Home Value in this Area
Purchase History
| Date | Buyer | Sale Price | Title Company |
|---|---|---|---|
| Clements Skelton Company Llc | -- | Title Resources | |
| Skelton Steven | -- | Transtar National Title | |
| Skelton Steven P | -- | Reunion Title | |
| Wickwood Development Corp | -- | Title Resources Of North Tx |
Source: Public Records
Mortgage History
| Date | Status | Borrower | Loan Amount |
|---|---|---|---|
| Previous Owner | Skelton Steven | $95,250 | |
| Previous Owner | Skelton Steven P | $87,720 | |
| Previous Owner | Wickwood Development Corp | $93,000 | |
| Closed | Wickwood Development Corp | $93,000 | |
| Closed | Skelton Steven P | $21,900 |
Source: Public Records
Tax History Compared to Growth
Tax History
| Year | Tax Paid | Tax Assessment Tax Assessment Total Assessment is a certain percentage of the fair market value that is determined by local assessors to be the total taxable value of land and additions on the property. | Land | Improvement |
|---|---|---|---|---|
| 2025 | $5,260 | $262,000 | $73,314 | $188,686 |
| 2024 | $5,260 | $260,278 | $73,314 | $186,964 |
| 2023 | $5,290 | $261,000 | $55,940 | $205,060 |
| 2022 | $4,879 | $220,000 | $59,059 | $160,941 |
| 2021 | $3,760 | $178,897 | $38,938 | $139,959 |
| 2020 | $3,786 | $171,120 | $38,938 | $132,182 |
| 2019 | $3,893 | $171,000 | $38,938 | $132,062 |
| 2018 | $3,685 | $161,000 | $38,938 | $122,062 |
| 2017 | $3,289 | $143,000 | $38,938 | $104,062 |
| 2016 | $3,273 | $140,512 | $38,938 | $101,574 |
| 2015 | $2,857 | $127,896 | $20,365 | $107,531 |
| 2014 | $2,857 | $122,965 | $20,365 | $102,600 |
| 2013 | -- | $117,583 | $20,365 | $97,218 |
Source: Public Records
Map
Nearby Homes
- 1149 Serendipity Cir
- 1009 Porter Place
- 4063 Farm To Market 455 W
- TBD Interstate 35
- 1209 Bolivar St
- 411 Hughes St
- 4551 Farm To Market Road 455
- 106 W Holt St
- 1010 Bolivar St
- 818 N Tejas Dr
- 820 N Tejas Dr
- 902 Plum St
- 2504 Santa fe Trail
- 702 Peach St Unit 2
- 710 W Willow St
- 2037 Duck Creek Rd
- 109 S 5th St
- 11306 Jennifer Cir
- 509 Marshall St
- 2501 Caddo Trail
- 1021 Porter Place
- 1017 Porter Place
- 1023 Porter Place
- 1015 Porter Place
- 1020 Porter Place
- 1022 Porter Place
- 1013 Porter Place
- 1025 Porter Place
- 1024 Porter Place
- 1018 Porter Place
- 1016 Porter Place
- 1011 Porter Place
- 1027 Porter Place
- 1014 Porter Place
- 1120 Serendipity Cir
- 1122 Serendipity Cir
- 1124 Serendipity Cir
- 1118 Serendipity Cir
- 1012 Porter Place
- 1116 Serendipity Cir