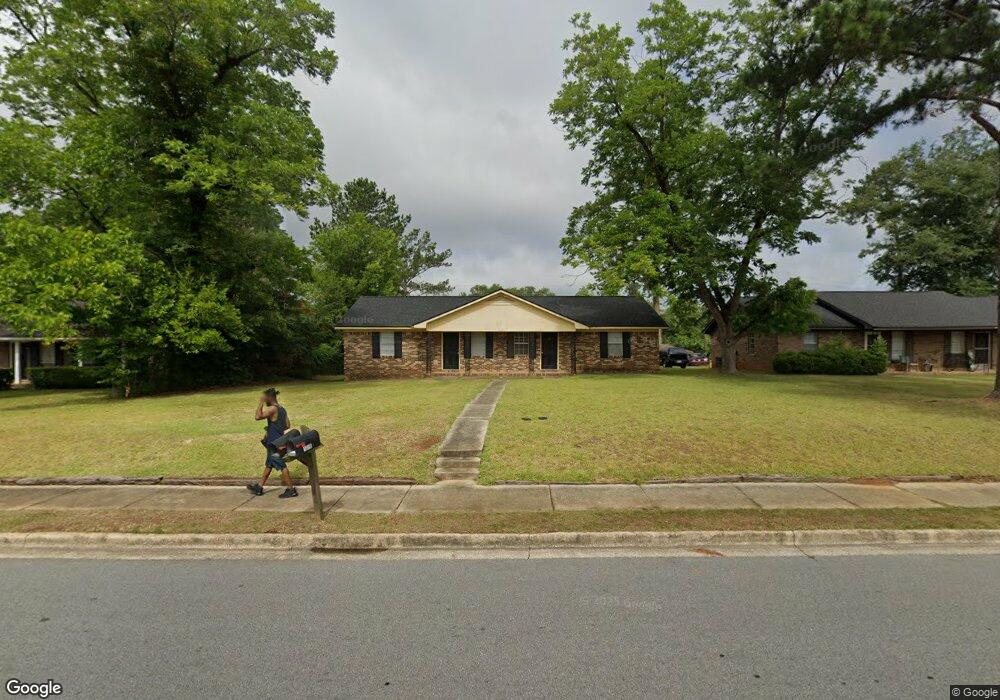
1019 University St Albany, GA 31707
Estimated Value: $95,125 - $124,000
4
Beds
2
Baths
1,778
Sq Ft
$62/Sq Ft
Est. Value
About This Home
This home is located at 1019 University St, Albany, GA 31707 and is currently estimated at $110,281, approximately $62 per square foot. 1019 University St is a home located in Dougherty County with nearby schools including West Town Elementary School, Southside Middle School, and Monroe High School.
Ownership History
Date
Name
Owned For
Owner Type
Purchase Details
Closed on
Jul 25, 2020
Sold by
Mcpherson Christine P
Bought by
Mcphersons Rentals Inc
Current Estimated Value
Purchase Details
Closed on
Sep 26, 2005
Sold by
Mcphersons Rentals Inc
Bought by
Mcpherson Christine P and Mcpherson William H
Purchase Details
Closed on
Aug 2, 2005
Sold by
Reid E Mills Llc
Bought by
Mcpherson'S Rentals Inc
Purchase Details
Closed on
Nov 23, 1999
Sold by
Mills Reid E Aka Reid Mills
Bought by
Reid E Mills Llc
Purchase Details
Closed on
Jul 9, 1998
Sold by
Emgram Ann T
Bought by
Mills Reid E
Purchase Details
Closed on
Aug 11, 1997
Sold by
Engram B Samuel
Bought by
Engram Ann T
Purchase Details
Closed on
Dec 3, 1979
Sold by
Engram Ann T
Bought by
Engram B Samuel
Create a Home Valuation Report for This Property
The Home Valuation Report is an in-depth analysis detailing your home's value as well as a comparison with similar homes in the area
Home Values in the Area
Average Home Value in this Area
Purchase History
| Date | Buyer | Sale Price | Title Company |
|---|---|---|---|
| Mcphersons Rentals Inc | -- | -- | |
| Mcpherson Christine P | -- | -- | |
| Mcpherson'S Rentals Inc | $55,000 | -- | |
| Reid E Mills Llc | -- | -- | |
| Mills Reid E | $42,000 | -- | |
| Engram Ann T | -- | -- | |
| Engram B Samuel | -- | -- |
Source: Public Records
Tax History Compared to Growth
Tax History
| Year | Tax Paid | Tax Assessment Tax Assessment Total Assessment is a certain percentage of the fair market value that is determined by local assessors to be the total taxable value of land and additions on the property. | Land | Improvement |
|---|---|---|---|---|
| 2024 | $1,229 | $25,760 | $3,280 | $22,480 |
| 2023 | $1,200 | $25,760 | $3,280 | $22,480 |
| 2022 | $1,205 | $25,760 | $3,280 | $22,480 |
| 2021 | $1,117 | $25,760 | $3,280 | $22,480 |
| 2020 | $1,119 | $25,760 | $3,280 | $22,480 |
| 2019 | $1,124 | $25,760 | $3,280 | $22,480 |
| 2018 | $1,128 | $25,760 | $3,280 | $22,480 |
| 2017 | $1,051 | $25,760 | $3,280 | $22,480 |
| 2016 | $1,052 | $25,760 | $3,280 | $22,480 |
| 2015 | $1,055 | $25,760 | $3,280 | $22,480 |
| 2014 | $1,041 | $25,760 | $3,280 | $22,480 |
Source: Public Records
Map
Nearby Homes
- 1104 University St
- 1003 University St
- 2102 Techwood Dr
- 2013 Jones Ave
- 501 Endicott Ln
- 410 Endicott Ln
- 2303 Joel Dr
- 1918 Colquitt Ave
- 1904 Avalon Ave
- 1906 W Whitney Ave
- 802 Colquitt Cir
- 1804 W Lincoln Ave
- 1714 W Lincoln Ave
- 1804 W Whitney Ave
- 1810 Edgerly Ave
- 1926 W Oglethorpe Ave
- 400 S Shadowlawn Dr
- 1916 W Broad Ave
- 1902 W Broad Ave
- 1513 Colquitt Ave
- 1017 University St
- 1021 University St
- 1015 University St
- 1023 University St
- 1016 Davidson Dr
- 1018 Davidson Dr
- 1014 Davidson Dr Unit A
- 1014 Davidson Dr
- 1020 University St
- 1022 University St
- 1020 Davidson Dr
- 1013 University St
- 1101 University St
- 1012 Davidson Dr
- 1014 University St
- 1024 University St
- 0000 University St
- 1022 Davidson Dr
- 1011 University St
- 1010 Davidson Dr