Estimated Value: $657,000 - $754,000
3
Beds
4
Baths
1,640
Sq Ft
$429/Sq Ft
Est. Value
About This Home
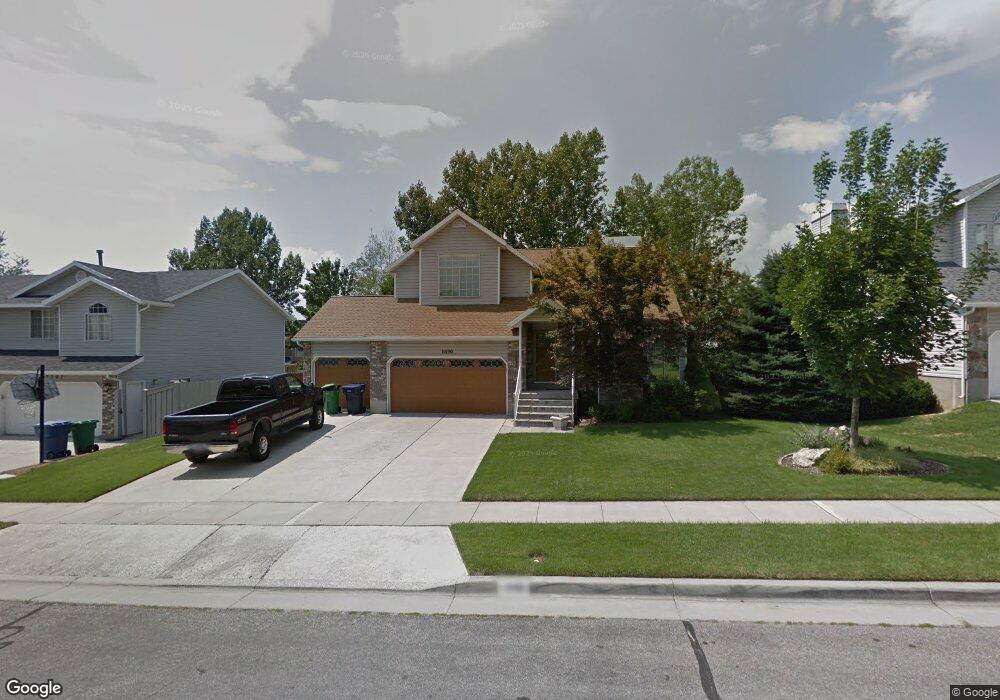
This home is located at 10190 Calla Lily Way, Sandy, UT 84092 and is currently estimated at $702,763, approximately $428 per square foot. 10190 Calla Lily Way is a home located in Salt Lake County with nearby schools including Willow Canyon Elementary School, Eastmont Middle School, and Jordan High.
Ownership History
Date
Name
Owned For
Owner Type
Purchase Details
Closed on
Jul 16, 2020
Sold by
Boyle Andrea G and Andrea Gabriella Boyle Living
Bought by
Boyle Andrea G and Andrea Gabriella Boyle Living
Current Estimated Value
Home Financials for this Owner
Home Financials are based on the most recent Mortgage that was taken out on this home.
Original Mortgage
$175,000
Outstanding Balance
$139,597
Interest Rate
3.1%
Mortgage Type
New Conventional
Estimated Equity
$563,166
Purchase Details
Closed on
Dec 3, 2018
Sold by
Boyle Andrea G
Bought by
Boyle Andrea G and The Andrea Gabriella Boyle Liv
Purchase Details
Closed on
Aug 23, 2016
Sold by
Boyle Howard P and Boyle Andrea
Bought by
Boyle Andrea G
Home Financials for this Owner
Home Financials are based on the most recent Mortgage that was taken out on this home.
Original Mortgage
$160,000
Interest Rate
2.72%
Mortgage Type
New Conventional
Create a Home Valuation Report for This Property
The Home Valuation Report is an in-depth analysis detailing your home's value as well as a comparison with similar homes in the area
Home Values in the Area
Average Home Value in this Area
Purchase History
| Date | Buyer | Sale Price | Title Company |
|---|---|---|---|
| Boyle Andrea G | -- | Vanguard Title Ins Agcy | |
| Boyle Andrea G | -- | None Available | |
| Boyle Andrea G | -- | Investors Title Ins Agency |
Source: Public Records
Mortgage History
| Date | Status | Borrower | Loan Amount |
|---|---|---|---|
| Open | Boyle Andrea G | $175,000 | |
| Closed | Boyle Andrea G | $160,000 |
Source: Public Records
Tax History Compared to Growth
Tax History
| Year | Tax Paid | Tax Assessment Tax Assessment Total Assessment is a certain percentage of the fair market value that is determined by local assessors to be the total taxable value of land and additions on the property. | Land | Improvement |
|---|---|---|---|---|
| 2025 | $3,256 | $652,300 | $303,900 | $348,400 |
| 2024 | $3,256 | $633,200 | $292,500 | $340,700 |
| 2023 | $3,090 | $591,400 | $281,300 | $310,100 |
| 2022 | $2,951 | $555,600 | $275,800 | $279,800 |
| 2021 | $2,619 | $420,400 | $212,100 | $208,300 |
| 2020 | $2,696 | $408,600 | $212,100 | $196,500 |
| 2019 | $2,736 | $404,800 | $200,100 | $204,700 |
| 2018 | $2,250 | $348,900 | $200,100 | $148,800 |
| 2017 | $2,055 | $305,000 | $200,100 | $104,900 |
| 2016 | $2,107 | $302,700 | $180,300 | $122,400 |
| 2015 | $2,450 | $296,700 | $203,700 | $93,000 |
| 2014 | $2,272 | $297,400 | $189,300 | $108,100 |
Source: Public Records
Map
Nearby Homes
- 10228 Snow Iris Way
- 10172 Snow Iris Way
- 10273 Flanders Rd
- 9979 S Albury Rd
- 9968 S Blossom Dr
- 9977 Lannae Dr
- 1584 Petunia Way
- 1157 E Sego Lily Dr
- 10557 S Primrose Dr
- 9750 S Indian Ridge Dr
- 9968 S Flint Dr
- 1091 Larkspur Dr
- 1077 S Turquoise Way
- 2009 E Sweetbriar Ln
- 1356 Eastpoint Dr
- 920 E Violet Cir
- 1058 S Turquoise Way
- 1012 E Bell Dr
- 9633 S 1210 E
- 10433 S Carnation Dr
- 10190 S Calla Lily Way
- 10202 Calla Lily Way
- 10202 S Calla Lily Way
- 10178 Calla Lily Way
- 10178 S Calla Lily Way
- 1481 E Snow Cir
- 1481 Snow Cir
- 1485 Snow Cir
- 10189 S Calla Lily Way
- 10189 Calla Lily Way
- 10214 Calla Lily Way
- 10201 S Calla Lily Way
- 10166 Calla Lily Way
- 10201 Calla Lily Way
- 1478 Snow Iris Cir
- 10177 Calla Lily Way
- 10177 S Calla Lily Way
- 10213 Calla Lily Way
- 10213 S Calla Lily Way
- 1472 E Snow Iris Cir