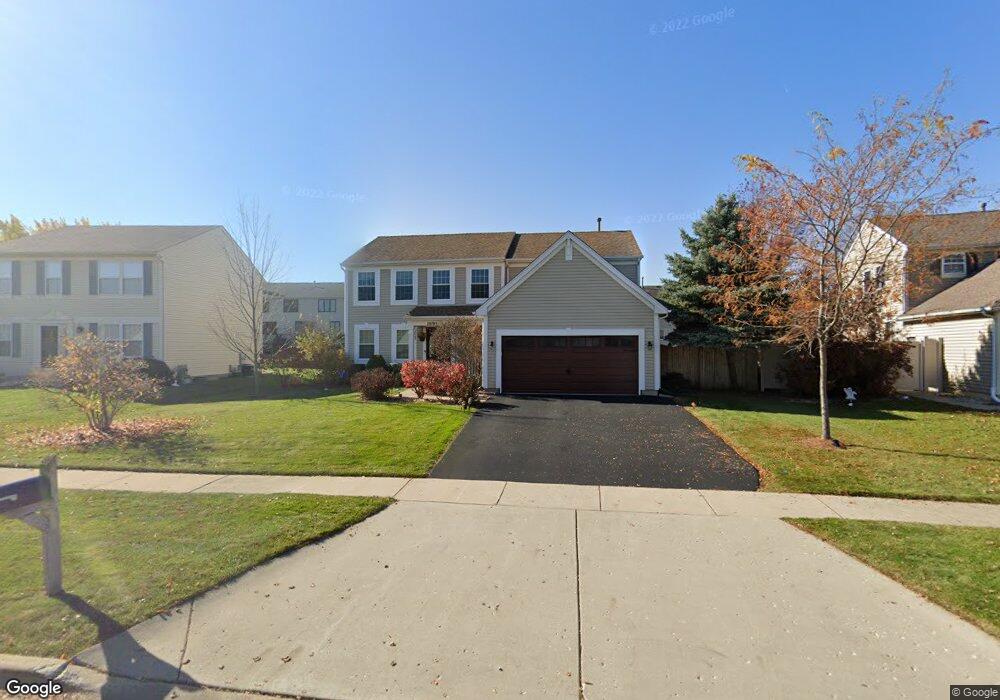
10195 Compton Dr Huntley, IL 60142
Estimated Value: $380,422 - $452,000
Studio
--
Bath
2,188
Sq Ft
$194/Sq Ft
Est. Value
About This Home
This home is located at 10195 Compton Dr, Huntley, IL 60142 and is currently estimated at $424,606, approximately $194 per square foot. 10195 Compton Dr is a home located in McHenry County with nearby schools including Martin Elementary School, Chesak Elementary School, and Marlowe Middle School.
Ownership History
Date
Name
Owned For
Owner Type
Purchase Details
Closed on
Sep 6, 2019
Sold by
Fanseiow Michael D and Fanselow Natalie K
Bought by
Fanseiow Michael D and Fanslow Natalie K
Current Estimated Value
Home Financials for this Owner
Home Financials are based on the most recent Mortgage that was taken out on this home.
Original Mortgage
$139,700
Outstanding Balance
$38,886
Interest Rate
3.7%
Mortgage Type
New Conventional
Estimated Equity
$385,720
Purchase Details
Closed on
Dec 21, 2017
Sold by
Fanselow Michael D and Fanselow Natalie K
Bought by
Fanselow Michael D and Fanselow Natalie K
Purchase Details
Closed on
Jan 14, 1999
Sold by
The Northern Trust Company
Bought by
Fanselow Michael D and Fanselow Natalie K
Home Financials for this Owner
Home Financials are based on the most recent Mortgage that was taken out on this home.
Original Mortgage
$160,500
Interest Rate
6.88%
Create a Home Valuation Report for This Property
The Home Valuation Report is an in-depth analysis detailing your home's value as well as a comparison with similar homes in the area
Home Values in the Area
Average Home Value in this Area
Purchase History
| Date | Buyer | Sale Price | Title Company |
|---|---|---|---|
| Fanseiow Michael D | -- | Amrock | |
| Fanselow Michael D | -- | Amrock | |
| Fanselow Michael D | -- | Tamara A Marshall | |
| Fanselow Michael D | $197,000 | -- |
Source: Public Records
Mortgage History
| Date | Status | Borrower | Loan Amount |
|---|---|---|---|
| Open | Fanselow Michael D | $139,700 | |
| Closed | Fanselow Michael D | $160,500 |
Source: Public Records
Tax History
| Year | Tax Paid | Tax Assessment Tax Assessment Total Assessment is a certain percentage of the fair market value that is determined by local assessors to be the total taxable value of land and additions on the property. | Land | Improvement |
|---|---|---|---|---|
| 2024 | $7,549 | $112,607 | $6,989 | $105,618 |
| 2023 | $7,337 | $101,156 | $6,278 | $94,878 |
| 2022 | $9,159 | $92,111 | $5,717 | $86,394 |
| 2021 | $8,808 | $86,750 | $5,384 | $81,366 |
| 2020 | $8,556 | $84,436 | $5,240 | $79,196 |
| 2019 | $8,419 | $82,280 | $5,106 | $77,174 |
| 2018 | $8,245 | $79,001 | $5,747 | $73,254 |
| 2017 | $8,114 | $74,452 | $5,416 | $69,036 |
| 2016 | $8,318 | $70,785 | $5,149 | $65,636 |
| 2013 | -- | $60,226 | $12,897 | $47,329 |
Source: Public Records
Map
Nearby Homes
- 10584 Scott Dr
- 2581 Stanton Cir
- 760 Normandy Ln
- 2800 Brisbane Dr
- 9204 Haligus Rd
- 5335 Lansbury Cir
- 4465 Barharbor Dr
- 3040 Banbury Ln
- 5420 Avalon Ln
- 9461 Welsh Ln
- 9103 Miller Rd Unit 2
- 9103 Miller Rd Unit 3
- 9103 Miller Rd Unit 4
- 9103 Miller Rd Unit 1
- 9103 Miller Rd Unit 5
- 4781 Highwood Ln
- 5270 Greenshire Cir
- 5259 Greenshire Cir
- 10429 Fleetwood St
- 4811 Princeton Ln
- 10191 Compton Dr
- 10197 Compton Dr
- 10194 Bennington Dr
- 10196 Bennington Dr
- 10185 Compton Dr
- 10188 Bennington Dr
- 10198 Bennington Dr
- 10196 Compton Dr
- 10186 Compton Dr
- 10184 Bennington Dr
- 10171 Compton Dr
- 10176 Compton Dr
- 9885 Compton Dr
- 10178 Bennington Dr
- 10166 Compton Dr
- 9892 Bennington Dr
- 10165 Compton Dr
- 9876 Compton Dr
- 10181 Dunhill Dr
- 10195 Bennington Dr
Your Personal Tour Guide
Ask me questions while you tour the home.