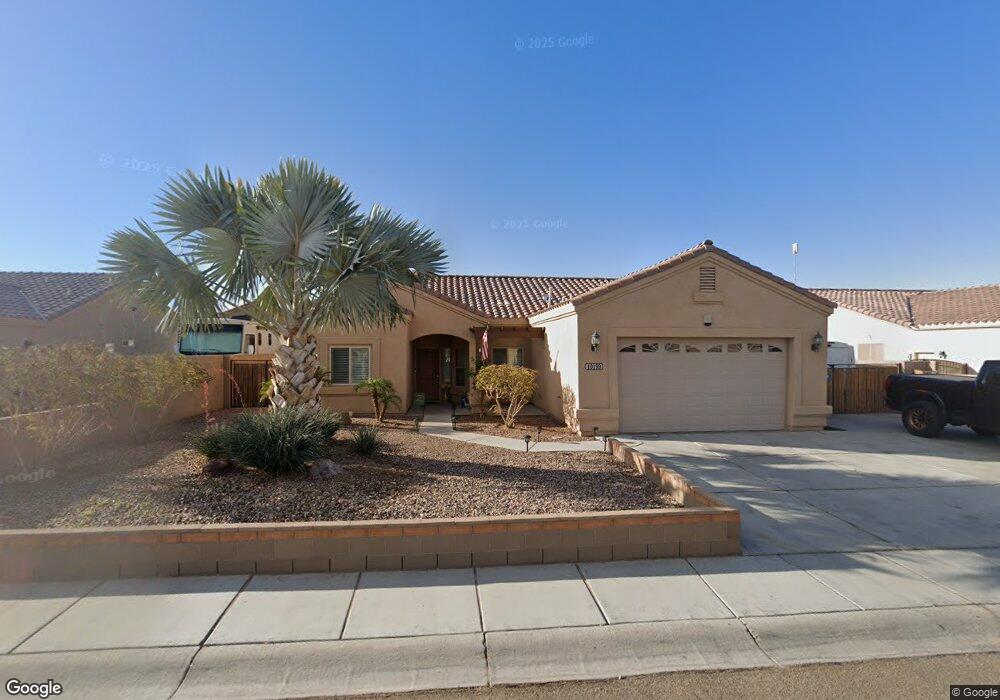
10199 E 38th Ln Yuma, AZ 85365
Fortuna Foothills NeighborhoodEstimated Value: $388,000 - $447,000
3
Beds
2
Baths
1,440
Sq Ft
$286/Sq Ft
Est. Value
About This Home
This home is located at 10199 E 38th Ln, Yuma, AZ 85365 and is currently estimated at $412,026, approximately $286 per square foot. 10199 E 38th Ln is a home with nearby schools including Mary A. Otondo Elementary School, Castle Dome Middle School, and Gila Ridge High School.
Ownership History
Date
Name
Owned For
Owner Type
Purchase Details
Closed on
Feb 26, 2025
Sold by
Gibson Cynthia A and Gibson Johnny A
Bought by
Cj Gibson2 Trust and Gibson
Current Estimated Value
Home Financials for this Owner
Home Financials are based on the most recent Mortgage that was taken out on this home.
Original Mortgage
$269,750
Outstanding Balance
$266,983
Interest Rate
6.95%
Mortgage Type
New Conventional
Estimated Equity
$145,043
Purchase Details
Closed on
Mar 29, 2021
Sold by
Gibson Johnny H and Gibson Cynthia A
Bought by
Gibson Johnny H and Gibson Cindy A
Purchase Details
Closed on
Oct 17, 2019
Sold by
Thomas Kathleen A and Unger Kathleen A
Bought by
Gibson Cynthia Ann and Gibson Johnny Howard
Purchase Details
Closed on
Mar 16, 2015
Sold by
Citizens Title & Trust
Bought by
Unger Kathleen A and Unger Paul B
Home Financials for this Owner
Home Financials are based on the most recent Mortgage that was taken out on this home.
Original Mortgage
$241,022
Interest Rate
3.54%
Mortgage Type
VA
Create a Home Valuation Report for This Property
The Home Valuation Report is an in-depth analysis detailing your home's value as well as a comparison with similar homes in the area
Home Values in the Area
Average Home Value in this Area
Purchase History
| Date | Buyer | Sale Price | Title Company |
|---|---|---|---|
| Cj Gibson2 Trust | -- | Chicago Title Agency | |
| Gibson Cynthia A | -- | Chicago Title Agency | |
| Gibson Johnny H | -- | None Available | |
| Gibson Cynthia Ann | $240,000 | Chicago Title Agency Inc | |
| Unger Kathleen A | $235,950 | Citizens Title |
Source: Public Records
Mortgage History
| Date | Status | Borrower | Loan Amount |
|---|---|---|---|
| Open | Gibson Cynthia A | $269,750 | |
| Previous Owner | Unger Kathleen A | $241,022 |
Source: Public Records
Tax History
| Year | Tax Paid | Tax Assessment Tax Assessment Total Assessment is a certain percentage of the fair market value that is determined by local assessors to be the total taxable value of land and additions on the property. | Land | Improvement |
|---|---|---|---|---|
| 2025 | $2,713 | $26,841 | $4,645 | $22,196 |
| 2024 | $2,699 | $25,562 | $4,387 | $21,175 |
| 2023 | $2,699 | $24,344 | $4,790 | $19,554 |
Source: Public Records
Map
Nearby Homes
- 10200 E 39th St
- 10163 E 38 Ln
- 10273 E 39th St
- 10237 E 39th St
- 10240 E 39th Way
- 10203 E 37th Place
- 10310 E 37th Place
- 10358 E 39th Way
- 10324 E 37th St
- 11653 S Chaparral Dr
- 10452 E 37th St
- 10534 E 38th Place
- 10134 E 35th St
- 9741 E 37th Place
- 9725 37th St
- 9736 36th Ln
- 9722 36th Ln
- 10617 E 37th St
- 9588 E 38th Ln
- 9649 E 36th St
- 10187 E 38th Ln
- 10211 E 38th Ln
- 10188 E 39th St
- 10198 E 38th Ln
- 10175 E 38th Ln
- 10198 E 38th Ln
- 10212 E 39th St
- 10210 E 38th Ln
- 10176 E 39th St
- 10222 E 38th Ln
- 10190 E 39th St
- 10224 E 39th St
- 10234 E 38th Ln
- 10235 E 38th Ln
- 10164 E 39th St
- 10203 E 38th Place
- 10193 E 38th Place
- 10236 E 39th St
- 10213 E 38th Place
- 10183 E 38th Place
Your Personal Tour Guide
Ask me questions while you tour the home.