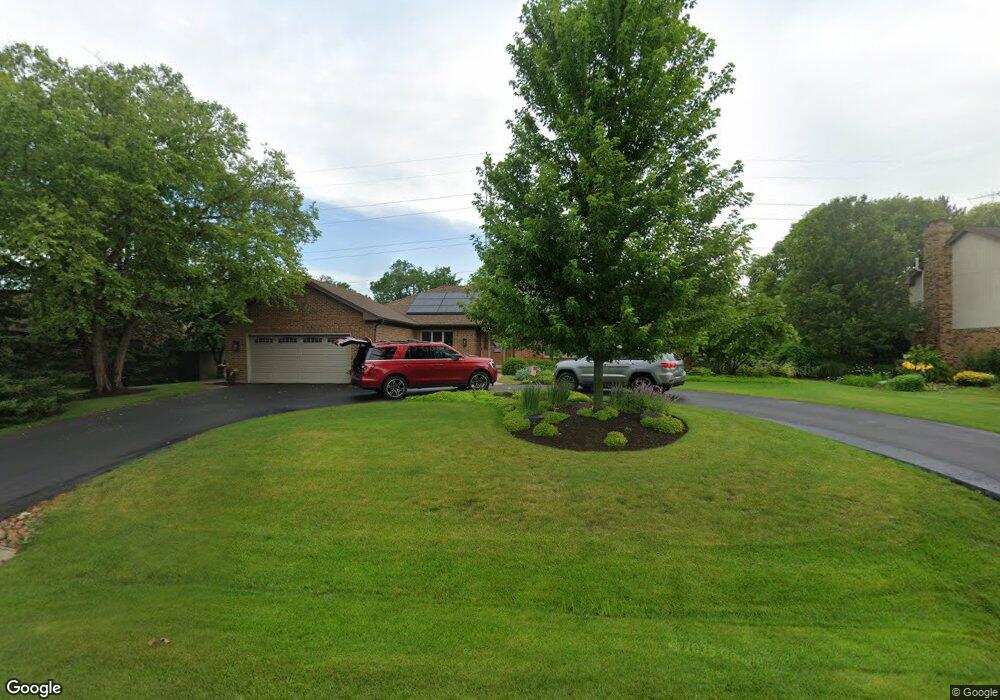
102 Andover Dr Prospect Heights, IL 60070
Estimated Value: $628,000 - $726,000
3
Beds
3
Baths
2,400
Sq Ft
$284/Sq Ft
Est. Value
About This Home
This home is located at 102 Andover Dr, Prospect Heights, IL 60070 and is currently estimated at $680,746, approximately $283 per square foot. 102 Andover Dr is a home located in Cook County with nearby schools including Dwight D Eisenhower Elementary School, Anne Sullivan Elementary School, and Betsy Ross Elementary School.
Ownership History
Date
Name
Owned For
Owner Type
Purchase Details
Closed on
May 29, 2008
Sold by
Biernacki Brian
Bought by
Wamsley Robert B and Wamsley Patricia M
Current Estimated Value
Home Financials for this Owner
Home Financials are based on the most recent Mortgage that was taken out on this home.
Original Mortgage
$225,000
Interest Rate
6.09%
Mortgage Type
Purchase Money Mortgage
Purchase Details
Closed on
Mar 2, 2004
Sold by
Vandenbossche Patrick and Capon Annelise
Bought by
Biernacki Brian
Home Financials for this Owner
Home Financials are based on the most recent Mortgage that was taken out on this home.
Original Mortgage
$360,800
Interest Rate
6.9%
Mortgage Type
Unknown
Purchase Details
Closed on
May 26, 1999
Sold by
Continental Community Bank & Trust Co
Bought by
Vandenrossche Patrick and Caron Annelise
Home Financials for this Owner
Home Financials are based on the most recent Mortgage that was taken out on this home.
Original Mortgage
$281,600
Interest Rate
6.75%
Create a Home Valuation Report for This Property
The Home Valuation Report is an in-depth analysis detailing your home's value as well as a comparison with similar homes in the area
Home Values in the Area
Average Home Value in this Area
Purchase History
| Date | Buyer | Sale Price | Title Company |
|---|---|---|---|
| Wamsley Robert B | $525,000 | Ticor | |
| Biernacki Brian | $451,000 | Cti | |
| Vandenrossche Patrick | $352,000 | -- |
Source: Public Records
Mortgage History
| Date | Status | Borrower | Loan Amount |
|---|---|---|---|
| Closed | Wamsley Robert B | $225,000 | |
| Previous Owner | Biernacki Brian | $360,800 | |
| Previous Owner | Vandenrossche Patrick | $281,600 | |
| Closed | Vandenrossche Patrick | $35,200 |
Source: Public Records
Tax History Compared to Growth
Tax History
| Year | Tax Paid | Tax Assessment Tax Assessment Total Assessment is a certain percentage of the fair market value that is determined by local assessors to be the total taxable value of land and additions on the property. | Land | Improvement |
|---|---|---|---|---|
| 2024 | $11,828 | $45,325 | $16,056 | $29,269 |
| 2023 | $11,037 | $45,325 | $16,056 | $29,269 |
| 2022 | $11,037 | $45,325 | $16,056 | $29,269 |
| 2021 | $10,428 | $37,797 | $10,035 | $27,762 |
| 2020 | $10,229 | $37,797 | $10,035 | $27,762 |
| 2019 | $10,998 | $42,232 | $10,035 | $32,197 |
| 2018 | $11,249 | $39,824 | $8,529 | $31,295 |
| 2017 | $11,141 | $39,824 | $8,529 | $31,295 |
| 2016 | $10,620 | $39,824 | $8,529 | $31,295 |
| 2015 | $11,873 | $40,413 | $7,526 | $32,887 |
| 2014 | $11,765 | $40,413 | $7,526 | $32,887 |
| 2013 | $11,457 | $40,413 | $7,526 | $32,887 |
Source: Public Records
Map
Nearby Homes
- 11 W Palatine Rd
- 307 Anne Ct
- 1201 Pleasant Run Dr Unit 312
- 21 E Stonegate Dr
- 1500 Sandstone Dr Unit 307
- 1430 Sandstone Dr Unit 202
- 1014 N Elmhurst Rd
- 13 W Kenilworth Ave
- 1525 Sander Ct Unit 103
- 1912 N Coldspring Rd Unit 96
- 1450 Sandpebble Dr Unit 333
- 1450 Sandpebble Dr Unit 227
- 2060 N Charter Point Dr Unit 14
- 10 N Wildwood Dr
- 1550 Sandpebble Dr Unit 209
- 1376 Longacre Ln Unit 113
- 1949 N Charter Point Dr Unit 1949
- 1425 Sandpebble Dr Unit 227
- 1425 Sandpebble Dr Unit 340
- 1575 Sandpebble Dr Unit 226