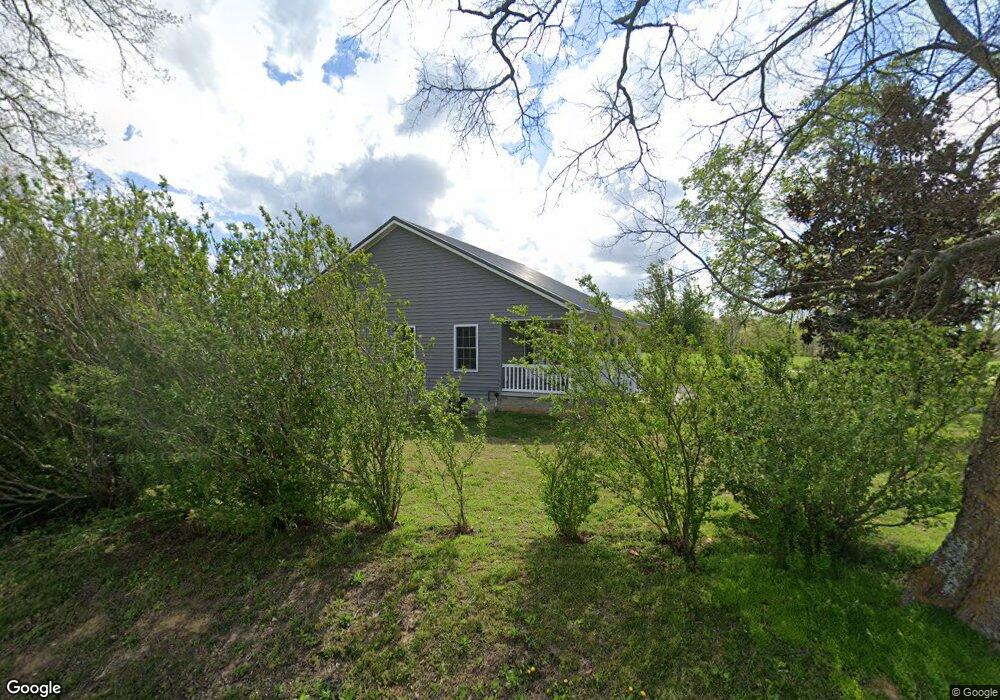
102 Beechland Rd Lewisburg, KY 42256
Estimated Value: $76,000 - $215,000
3
Beds
1
Bath
1,008
Sq Ft
$163/Sq Ft
Est. Value
About This Home
This home is located at 102 Beechland Rd, Lewisburg, KY 42256 and is currently estimated at $163,804, approximately $162 per square foot. 102 Beechland Rd is a home located in Logan County with nearby schools including Logan County High School, New Hope School, and Sands Springs School.
Ownership History
Date
Name
Owned For
Owner Type
Purchase Details
Closed on
Jan 7, 2025
Sold by
Hardison Monica Kelly and Hardison Chad Michael
Bought by
Hardison James Michael
Current Estimated Value
Home Financials for this Owner
Home Financials are based on the most recent Mortgage that was taken out on this home.
Original Mortgage
$220,000
Outstanding Balance
$218,437
Interest Rate
6.69%
Mortgage Type
New Conventional
Estimated Equity
-$54,633
Purchase Details
Closed on
Aug 9, 2018
Sold by
White Joey and White Sherri H
Bought by
Hardison Chad Michael and Hardison Monica Kelly
Purchase Details
Closed on
Oct 23, 2009
Sold by
Race William M and Rece Lillian
Bought by
Hardison Chad and Hardison Kelly
Home Financials for this Owner
Home Financials are based on the most recent Mortgage that was taken out on this home.
Original Mortgage
$81,000
Interest Rate
5.01%
Mortgage Type
Future Advance Clause Open End Mortgage
Create a Home Valuation Report for This Property
The Home Valuation Report is an in-depth analysis detailing your home's value as well as a comparison with similar homes in the area
Home Values in the Area
Average Home Value in this Area
Purchase History
| Date | Buyer | Sale Price | Title Company |
|---|---|---|---|
| Hardison James Michael | -- | Clark Title | |
| Hardison James Michael | -- | Clark Title | |
| Hardison Chad Michael | $50,000 | None Available | |
| Hardison Chad | $90,000 | None Available |
Source: Public Records
Mortgage History
| Date | Status | Borrower | Loan Amount |
|---|---|---|---|
| Open | Hardison James Michael | $220,000 | |
| Closed | Hardison James Michael | $220,000 | |
| Previous Owner | Hardison Chad | $81,000 |
Source: Public Records
Tax History Compared to Growth
Tax History
| Year | Tax Paid | Tax Assessment Tax Assessment Total Assessment is a certain percentage of the fair market value that is determined by local assessors to be the total taxable value of land and additions on the property. | Land | Improvement |
|---|---|---|---|---|
| 2024 | $834 | $94,000 | $15,000 | $79,000 |
| 2023 | $734 | $80,500 | $15,000 | $65,500 |
| 2022 | $726 | $80,500 | $15,000 | $65,500 |
| 2021 | $728 | $80,500 | $15,000 | $65,500 |
| 2020 | $739 | $80,500 | $15,000 | $65,500 |
| 2019 | $737 | $80,500 | $15,000 | $65,500 |
| 2018 | $145 | $16,000 | $10,000 | $6,000 |
| 2017 | $143 | $16,000 | $10,000 | $6,000 |
| 2016 | $141 | $16,000 | $0 | $0 |
| 2015 | $565 | $16,000 | $10,000 | $6,000 |
| 2012 | $565 | $70,000 | $0 | $0 |
Source: Public Records
Map
Nearby Homes
- 113 Reservoir Dr
- 0 Angela Way Unit Lot 7 Deep Water Est
- Lot 4 Malone Meadows SW
- 0 Angela Way Unit 11452863
- 181 Sunset St
- Lot 13 Malone Meadows SW
- 200 Graham Rd
- 689 Lost City Spur Rd
- 460 Oak St
- 460 Oak St
- 140 Wonder St
- 427 7th St
- 4611 Quality Rd
- 4805 Quality Rd
- 1195 Beechland Quality Rd
- 5535 Quality Rd
- 1433 Spa Rd
- 0 Diamond Springs Station Rd
- 254 Holloway Rd
- 1729 Thompson School Rd
- 2106 Quality Rd
- 88 Iron Mountain Rd
- 55 Iron Mountain Rd
- 275 Beechland Rd
- 1898 Quality Rd
- 1647 Quality Rd
- 940 Mount Pleasant Rd
- 2395 Quality Rd
- 13 White Ln
- 841 Iron Mountain Rd
- 347 Iron Mountain Rd
- 358 Greasy Creek Rd
- 246 Greasy Creek Rd
- 242 Greasy Creek Rd
- 2405 Quality Rd
- 1496 Quality Rd
- 1471 Quality Rd
- 641 Mount Pleasant Rd
- 2511 Quality Rd
- 856 Beechland Rd