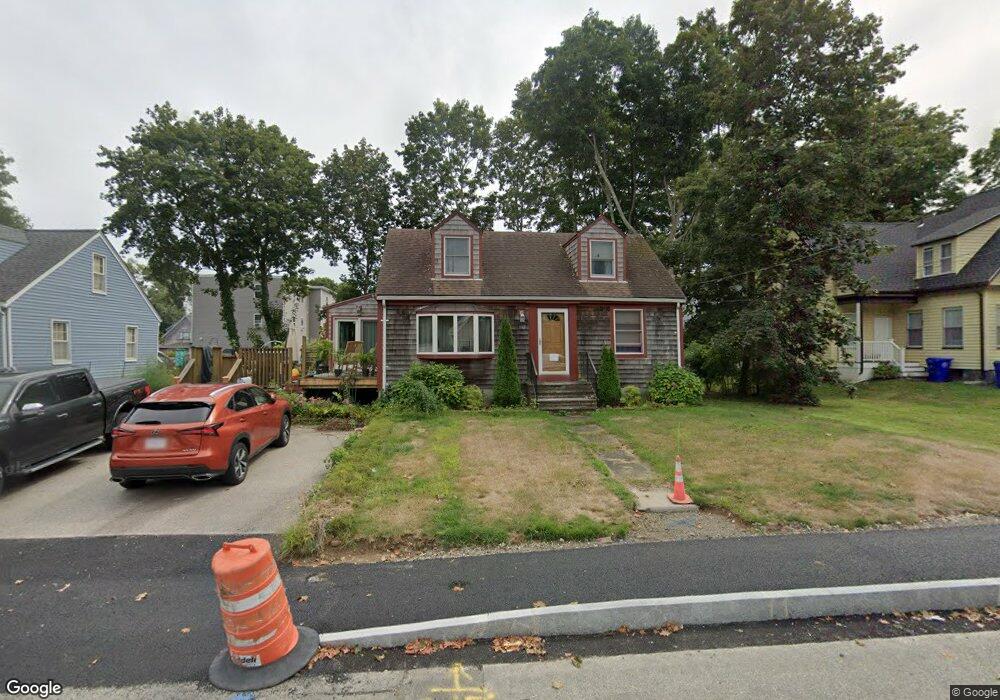
102 Belmont St Rockland, MA 02370
Estimated Value: $494,000 - $565,000
4
Beds
2
Baths
1,363
Sq Ft
$392/Sq Ft
Est. Value
About This Home
This home is located at 102 Belmont St, Rockland, MA 02370 and is currently estimated at $534,467, approximately $392 per square foot. 102 Belmont St is a home located in Plymouth County with nearby schools including Rockland Senior High School, Calvary Chapel Academy, and St Bridget School.
Ownership History
Date
Name
Owned For
Owner Type
Purchase Details
Closed on
Dec 30, 2002
Sold by
Bishop Allen G and Bishop Doris M
Bought by
Sullivan James M and Sullivan Diane
Current Estimated Value
Home Financials for this Owner
Home Financials are based on the most recent Mortgage that was taken out on this home.
Original Mortgage
$80,000
Interest Rate
6.02%
Mortgage Type
Purchase Money Mortgage
Create a Home Valuation Report for This Property
The Home Valuation Report is an in-depth analysis detailing your home's value as well as a comparison with similar homes in the area
Home Values in the Area
Average Home Value in this Area
Purchase History
| Date | Buyer | Sale Price | Title Company |
|---|---|---|---|
| Sullivan James M | $100,000 | -- |
Source: Public Records
Mortgage History
| Date | Status | Borrower | Loan Amount |
|---|---|---|---|
| Open | Sullivan James M | $46,000 | |
| Open | Sullivan James M | $150,000 | |
| Closed | Sullivan James M | $100,000 | |
| Closed | Sullivan James M | $80,000 |
Source: Public Records
Tax History Compared to Growth
Tax History
| Year | Tax Paid | Tax Assessment Tax Assessment Total Assessment is a certain percentage of the fair market value that is determined by local assessors to be the total taxable value of land and additions on the property. | Land | Improvement |
|---|---|---|---|---|
| 2025 | $6,486 | $474,500 | $223,200 | $251,300 |
| 2024 | $6,296 | $447,800 | $210,500 | $237,300 |
| 2023 | $6,112 | $401,600 | $183,500 | $218,100 |
| 2022 | $5,896 | $352,000 | $159,500 | $192,500 |
| 2021 | $5,542 | $320,700 | $145,000 | $175,700 |
| 2020 | $5,348 | $305,600 | $138,100 | $167,500 |
| 2019 | $5,222 | $291,400 | $131,600 | $159,800 |
| 2018 | $4,947 | $271,500 | $131,600 | $139,900 |
| 2017 | $16,676 | $252,200 | $124,700 | $127,500 |
| 2016 | $4,484 | $242,500 | $119,900 | $122,600 |
| 2015 | $4,284 | $225,100 | $112,000 | $113,100 |
| 2014 | $4,233 | $230,800 | $109,900 | $120,900 |
Source: Public Records
Map
Nearby Homes
- 122 Reed St
- 6 Chestnut Cir
- 11 Chestnut Cir
- 1 Canterbury Ln
- 45-47 Park St
- 63 Webster St
- 103 Grove St Unit 337
- 11 Dyer St Unit 11
- 13 Dyer St Unit 13
- 119 Grove St Unit 238
- 119 Grove St Unit 223
- 12 Dyer St Unit 12
- 14 Dyer St Unit 14
- 135 Grove St Unit 110
- 98 Myrtle St
- 20 Birch St
- 140 W Water St
- 23 Payson Ave
- 46 Wardson Cir
- 45 Leisurewoods Dr
- 96 Belmont St
- 108 Belmont St
- 95 Pacific St
- 89 Pacific St Unit 91
- 89 Pacific St Unit 2
- 83 Pacific St
- 101 Belmont St
- 95 Belmont St
- 77 Pacific St
- 87 Belmont St
- 113 Pacific St
- 113 Belmont St
- 71 Pacific St
- 100 Pacific St
- 92 Pacific St
- 128 Belmont St
- 121 Pacific St
- 88 Pacific St
- 108 Pacific St
- 127 Belmont St