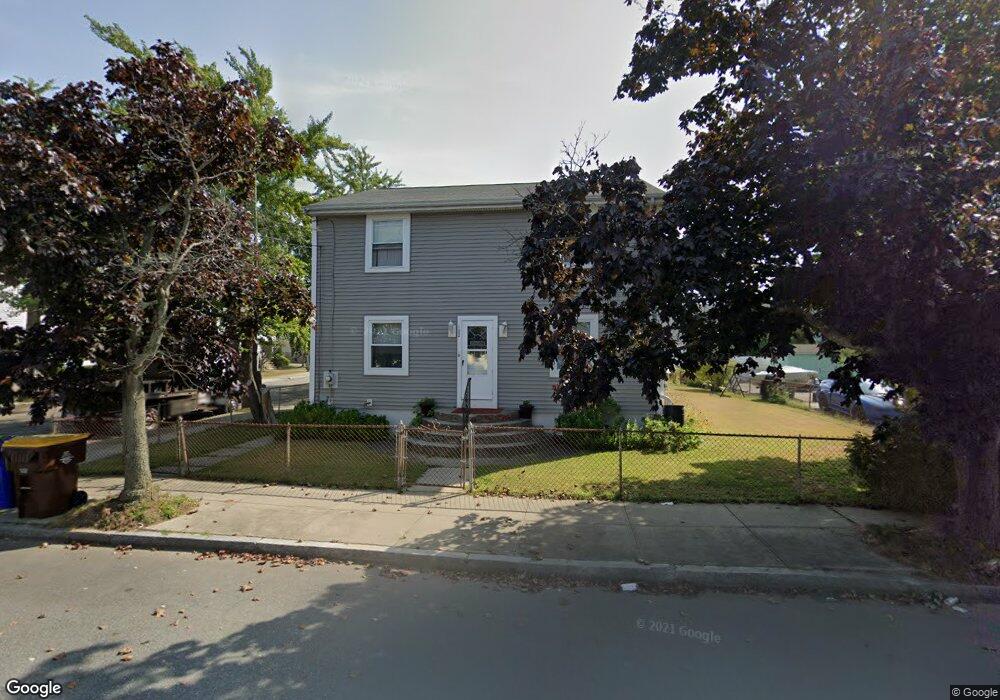
102 Bush St Fall River, MA 02724
Father Kelly NeighborhoodEstimated Value: $356,719 - $405,000
3
Beds
1
Bath
1,537
Sq Ft
$247/Sq Ft
Est. Value
About This Home
This home is located at 102 Bush St, Fall River, MA 02724 and is currently estimated at $379,180, approximately $246 per square foot. 102 Bush St is a home located in Bristol County with nearby schools including Henry Lord Community School, B M C Durfee High School, and Argosy Collegiate Charter School.
Ownership History
Date
Name
Owned For
Owner Type
Purchase Details
Closed on
Jun 14, 2022
Sold by
Costa John E Est
Bought by
Costa John E
Current Estimated Value
Home Financials for this Owner
Home Financials are based on the most recent Mortgage that was taken out on this home.
Original Mortgage
$56,000
Outstanding Balance
$42,976
Interest Rate
5.23%
Mortgage Type
Stand Alone Refi Refinance Of Original Loan
Estimated Equity
$330,114
Purchase Details
Closed on
Aug 26, 2003
Sold by
Casemiro Nancy R
Bought by
Costa Joseph Jr Est and Costa John
Home Financials for this Owner
Home Financials are based on the most recent Mortgage that was taken out on this home.
Original Mortgage
$90,000
Interest Rate
5.52%
Mortgage Type
Purchase Money Mortgage
Create a Home Valuation Report for This Property
The Home Valuation Report is an in-depth analysis detailing your home's value as well as a comparison with similar homes in the area
Home Values in the Area
Average Home Value in this Area
Purchase History
| Date | Buyer | Sale Price | Title Company |
|---|---|---|---|
| Costa John E | -- | None Available | |
| Costa Joseph Jr Est | $77,000 | -- |
Source: Public Records
Mortgage History
| Date | Status | Borrower | Loan Amount |
|---|---|---|---|
| Previous Owner | Costa Joseph Jr Est | $90,000 |
Source: Public Records
Tax History Compared to Growth
Tax History
| Year | Tax Paid | Tax Assessment Tax Assessment Total Assessment is a certain percentage of the fair market value that is determined by local assessors to be the total taxable value of land and additions on the property. | Land | Improvement |
|---|---|---|---|---|
| 2025 | $3,130 | $273,400 | $108,400 | $165,000 |
| 2024 | $2,929 | $254,900 | $104,400 | $150,500 |
| 2023 | $2,829 | $230,600 | $86,300 | $144,300 |
| 2022 | $2,542 | $201,400 | $82,200 | $119,200 |
| 2021 | $2,491 | $180,100 | $78,200 | $101,900 |
| 2020 | $2,487 | $172,100 | $77,000 | $95,100 |
| 2019 | $2,398 | $164,500 | $74,200 | $90,300 |
| 2018 | $2,382 | $162,900 | $80,300 | $82,600 |
| 2017 | $2,208 | $157,700 | $76,600 | $81,100 |
| 2016 | $2,145 | $157,400 | $81,500 | $75,900 |
| 2015 | $2,060 | $157,500 | $81,500 | $76,000 |
| 2014 | $1,951 | $155,100 | $79,100 | $76,000 |
Source: Public Records
Map
Nearby Homes
- 135 Vale St Unit 1
- 151 Winthrop St
- 1244 Globe St
- 493 Peckham St
- 1004 Slade St
- 497 E Main St
- 159 Stafford Rd
- 107 Palmer St
- 71 Mystic St Unit 4
- 27 Cook St
- 49 Stafford Rd
- 49 Hamlet St
- 1166 S Main St
- 129 Melville St
- 23 Tillson St
- 1334 S Main St
- 516 Whipple St
- 583 Center St
- 1313 So Main St Unit 2
- 43 Kilburn St