Estimated Value: $75,597 - $131,000
--
Bed
1
Bath
936
Sq Ft
$108/Sq Ft
Est. Value
About This Home
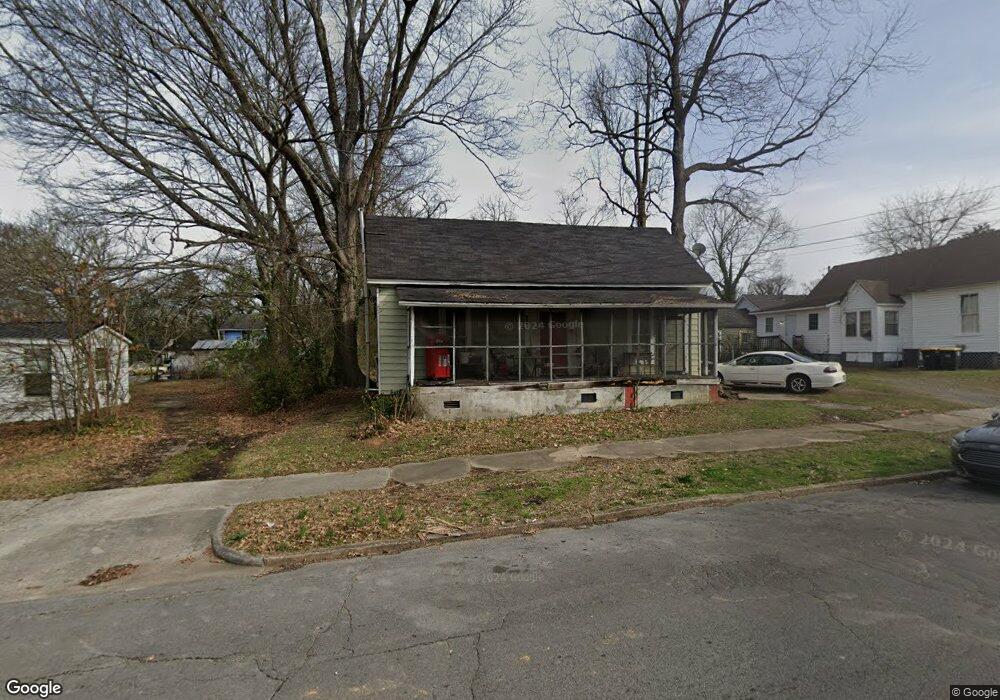
This home is located at 102 Butler St SW, Rome, GA 30161 and is currently estimated at $100,899, approximately $107 per square foot. 102 Butler St SW is a home located in Floyd County with nearby schools including Dan McCarty Middle School, Rome High School, and Darlington School.
Ownership History
Date
Name
Owned For
Owner Type
Purchase Details
Closed on
Mar 6, 2016
Sold by
Fluker Quincy Jamar
Bought by
Hines Michael Latoya
Current Estimated Value
Purchase Details
Closed on
Apr 14, 2015
Sold by
P and R
Bought by
P and R
Purchase Details
Closed on
Jul 13, 2011
Sold by
Hines Michael Latoya
Bought by
Hines Michael Latoya
Purchase Details
Closed on
Jun 2, 2009
Sold by
Hatcher Ruby Lee
Bought by
Hines Michael Latoya
Purchase Details
Closed on
Aug 28, 1981
Sold by
Williams Paul C
Bought by
Hatcher Ruby Lee
Purchase Details
Closed on
Sep 26, 1980
Sold by
Redwine John W and Redwine Ruthie L
Bought by
Williams Paul C
Purchase Details
Closed on
Jun 8, 1972
Sold by
Mull Jc
Bought by
Redwine John W and Redwine Ruthie L
Purchase Details
Closed on
Mar 30, 1963
Sold by
Briggs Jl Estate
Bought by
Mull Jc
Purchase Details
Closed on
Jan 1, 1901
Bought by
Briggs Jl Estate
Create a Home Valuation Report for This Property
The Home Valuation Report is an in-depth analysis detailing your home's value as well as a comparison with similar homes in the area
Home Values in the Area
Average Home Value in this Area
Purchase History
| Date | Buyer | Sale Price | Title Company |
|---|---|---|---|
| Hines Michael Latoya | -- | -- | |
| P | -- | -- | |
| Hines Michael Latoya | $23,000 | -- | |
| Hines Michael Latoya | $1,700 | -- | |
| Hatcher Ruby Lee | $12,000 | -- | |
| Williams Paul C | $4,600 | -- | |
| Redwine John W | $5,900 | -- | |
| Mull Jc | -- | -- | |
| Briggs Jl Estate | -- | -- |
Source: Public Records
Tax History Compared to Growth
Tax History
| Year | Tax Paid | Tax Assessment Tax Assessment Total Assessment is a certain percentage of the fair market value that is determined by local assessors to be the total taxable value of land and additions on the property. | Land | Improvement |
|---|---|---|---|---|
| 2024 | $626 | $18,834 | $4,488 | $14,346 |
| 2023 | $667 | $16,761 | $4,080 | $12,681 |
| 2022 | $499 | $13,688 | $3,264 | $10,424 |
| 2021 | $466 | $12,553 | $3,264 | $9,289 |
| 2020 | $422 | $11,278 | $2,550 | $8,728 |
| 2019 | $369 | $9,968 | $2,550 | $7,418 |
| 2018 | $347 | $9,384 | $2,550 | $6,834 |
| 2017 | $336 | $9,074 | $2,550 | $6,524 |
| 2016 | $281 | $8,856 | $2,520 | $6,336 |
| 2015 | -- | $8,856 | $2,520 | $6,336 |
| 2014 | -- | $8,856 | $2,520 | $6,336 |
Source: Public Records
Map
Nearby Homes
- 107 Butler St SW
- 18 Butler St SW
- 515 Harper Ave SW
- 3 Grover St SW
- 515 S Broad St SW
- 110 Cherokee St SW
- 115 Lookout Cir SW
- 113 Lookout Cir SW
- 111 Lookout Cir SW
- 410 Hardy Ave SW
- 334 Branham Ave SW
- 232 S Broad St SW
- 529 Branham Ave SW
- 3 Porter St SW
- 105 Mary St SW
- 204 Myrtle St SW
- 101 Hardy Ave SW
- 218 Wilson Ave SW
- 106 Butler St SW
- 416 Harper Ave SW
- 414 Harper Ave SW
- 417 Pennington Ave SW
- 103 Butler St SW
- 415 Pennington Ave SW
- 0 Butler St Unit 8426856
- 101 Butler St SW
- 412 Harper Ave SW
- 413 Pennington Ave SW
- 503 Pennington Ave SW
- 503 Pennington Ave SW
- 26 Butler St SW
- 508 Harper Ave SW
- 411 Pennington Ave SW
- 509 Pennington Ave SW
- 25 McGhee St SW
- 510 Harper Ave SW
- 408 Harper Ave SW
- 24 Butler St SW