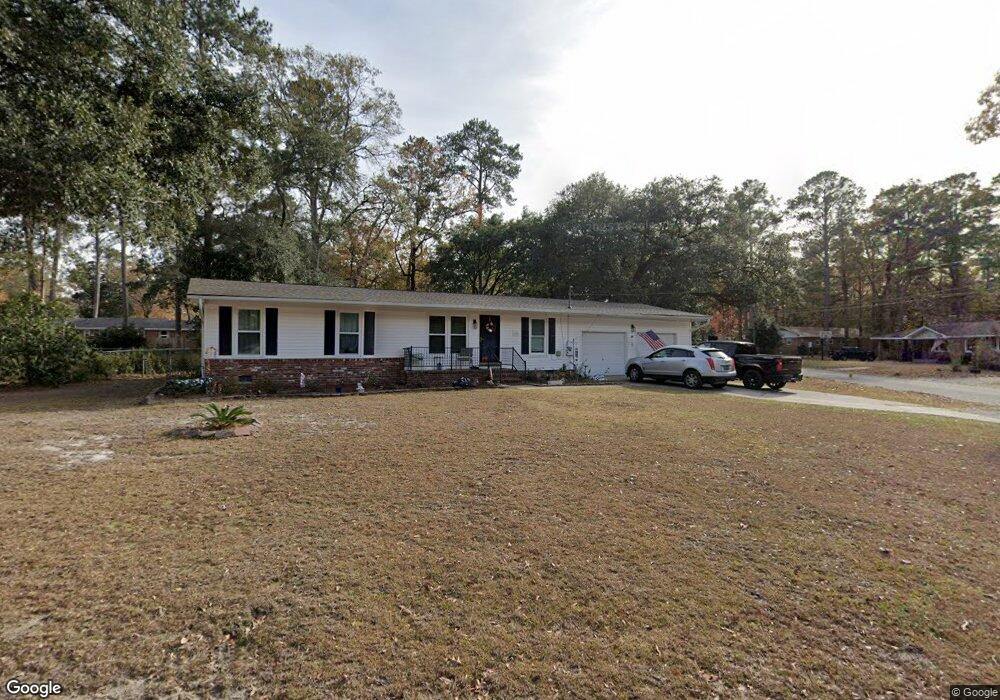
102 Camelia Dr Unit SUM Summerville, SC 29485
Estimated Value: $326,000 - $354,185
3
Beds
2
Baths
1,250
Sq Ft
$272/Sq Ft
Est. Value
About This Home
This home is located at 102 Camelia Dr Unit SUM, Summerville, SC 29485 and is currently estimated at $340,546, approximately $272 per square foot. 102 Camelia Dr Unit SUM is a home located in Dorchester County with nearby schools including James H. Spann Elementary School, Alston Middle School, and Summerville High School.
Ownership History
Date
Name
Owned For
Owner Type
Purchase Details
Closed on
Dec 2, 2021
Sold by
Fulton Daisy L
Bought by
Bosley Kathleen Susan and Jurmanovich Gerald Paul
Current Estimated Value
Home Financials for this Owner
Home Financials are based on the most recent Mortgage that was taken out on this home.
Original Mortgage
$249,287
Outstanding Balance
$229,371
Interest Rate
3.14%
Mortgage Type
FHA
Estimated Equity
$111,175
Purchase Details
Closed on
Nov 19, 2007
Sold by
Finucan Jack Theodore L
Bought by
Fulton Otis H and Fulton Daisy L
Purchase Details
Closed on
Feb 24, 2006
Sold by
Locklair Chadwick D and Locklair Christina A
Bought by
Finucan Jack Theodore L
Home Financials for this Owner
Home Financials are based on the most recent Mortgage that was taken out on this home.
Original Mortgage
$141,750
Interest Rate
6.08%
Mortgage Type
Adjustable Rate Mortgage/ARM
Purchase Details
Closed on
Dec 3, 1999
Sold by
Bowman George S
Bought by
Locklair Chadwick D
Create a Home Valuation Report for This Property
The Home Valuation Report is an in-depth analysis detailing your home's value as well as a comparison with similar homes in the area
Home Values in the Area
Average Home Value in this Area
Purchase History
| Date | Buyer | Sale Price | Title Company |
|---|---|---|---|
| Bosley Kathleen Susan | $265,000 | None Available | |
| Fulton Otis H | $154,230 | None Available | |
| Finucan Jack Theodore L | $157,500 | None Available | |
| Locklair Chadwick D | $81,900 | -- |
Source: Public Records
Mortgage History
| Date | Status | Borrower | Loan Amount |
|---|---|---|---|
| Open | Bosley Kathleen Susan | $249,287 | |
| Previous Owner | Finucan Jack Theodore L | $141,750 |
Source: Public Records
Tax History Compared to Growth
Tax History
| Year | Tax Paid | Tax Assessment Tax Assessment Total Assessment is a certain percentage of the fair market value that is determined by local assessors to be the total taxable value of land and additions on the property. | Land | Improvement |
|---|---|---|---|---|
| 2024 | $2,857 | $15,030 | $4,560 | $10,470 |
| 2023 | $2,857 | $10,333 | $2,000 | $8,333 |
| 2022 | $2,380 | $15,500 | $3,000 | $12,500 |
| 2021 | $589 | $4,910 | $1,730 | $3,180 |
| 2020 | $508 | $2,850 | $1,000 | $1,850 |
| 2019 | $501 | $2,850 | $1,000 | $1,850 |
| 2018 | $378 | $2,850 | $1,000 | $1,850 |
| 2017 | $374 | $2,850 | $1,000 | $1,850 |
| 2016 | $353 | $2,850 | $1,000 | $1,850 |
| 2015 | $354 | $2,850 | $1,000 | $1,850 |
| 2014 | $854 | $137,160 | $0 | $0 |
| 2013 | -- | $5,490 | $0 | $0 |
Source: Public Records
Map
Nearby Homes
- 114 Azalea Dr
- 107 Thrush Ln
- 411 Dogwood Cir
- 102 Sugarplum Dr
- 111 Long Bow Rd
- 129 Sycamore Dr
- 111 Flicker Ln
- 117 White Pine Way
- 210 Arbor Rd
- 102 Hope Dr
- 137 White Pine Way
- 139 White Pine Way
- 191 Telfair Ct
- 709 Black Oak Blvd
- 206 Garbon Dr
- RICHBURG Plan at Garbon Fields
- HOPKINS Plan at Garbon Fields
- 109 Rosefield Ct
- 557 Gahagan Rd
- 555 Gahagan Rd
- 102 Camelia Dr
- 104 Camelia Dr
- 106 Dogwood Cir
- 204 Lenwood Dr
- 104 Dogwood Cir
- 101 Camelia Dr
- 202 Lenwood Dr
- 108 Dogwood Cir
- 206 Lenwood Dr
- 110 Dogwood Cir
- 106 Camelia Dr
- 103 Camelia Dr
- 118 Lenwood Dr
- 208 Lenwood Dr
- 114 Lenwood Dr
- 203 Dogwood Cir
- 112 Dogwood Cir
- 105 Camelia Dr
- 116 Lenwood Dr
- 108 Camelia Dr