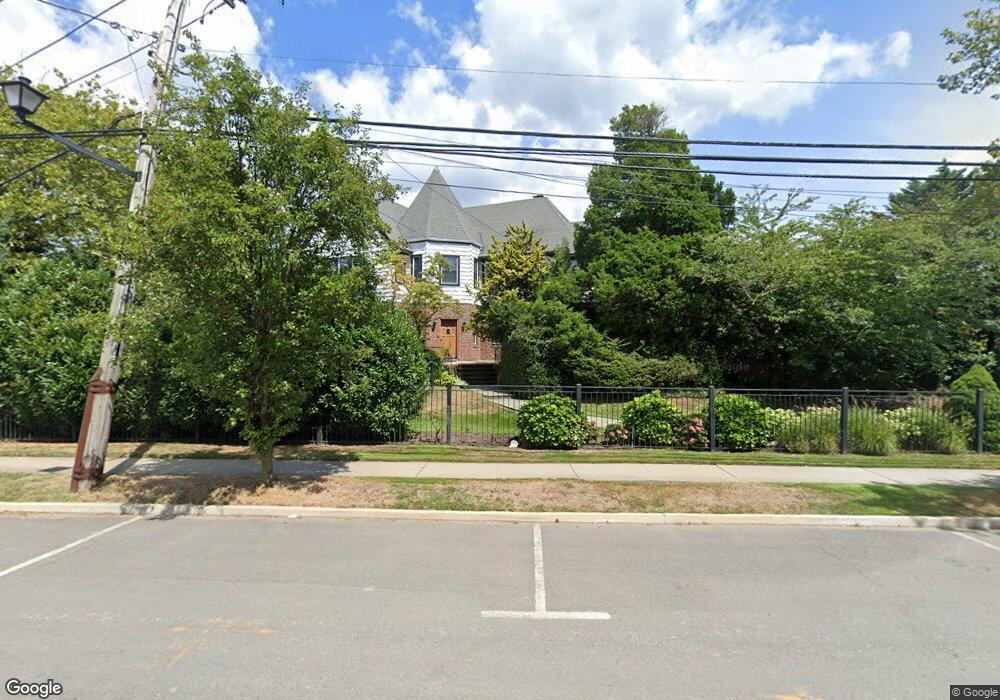
102 Causeway Lawrence, NY 11559
Estimated Value: $3,058,004 - $3,327,000
7
Beds
4
Baths
3,921
Sq Ft
$814/Sq Ft
Est. Value
About This Home
This home is located at 102 Causeway, Lawrence, NY 11559 and is currently estimated at $3,192,502, approximately $814 per square foot. 102 Causeway is a home located in Nassau County with nearby schools including Lawrence Elementary School, Lawrence Primary School, and Lawrence Middle School.
Ownership History
Date
Name
Owned For
Owner Type
Purchase Details
Closed on
Aug 21, 2024
Sold by
Shenker Joseph and Shenker Nina
Bought by
102 Causeway Owner Llc
Current Estimated Value
Purchase Details
Closed on
Jan 9, 2001
Sold by
Sattar Shazia
Bought by
Shenker Joseph
Purchase Details
Closed on
Feb 10, 1997
Purchase Details
Closed on
Mar 14, 1995
Sold by
Lemlich Betty Est
Bought by
Sattar Abdul and Quddus Abdul
Home Financials for this Owner
Home Financials are based on the most recent Mortgage that was taken out on this home.
Original Mortgage
$251,250
Interest Rate
8.78%
Mortgage Type
Purchase Money Mortgage
Create a Home Valuation Report for This Property
The Home Valuation Report is an in-depth analysis detailing your home's value as well as a comparison with similar homes in the area
Home Values in the Area
Average Home Value in this Area
Purchase History
| Date | Buyer | Sale Price | Title Company |
|---|---|---|---|
| 102 Causeway Owner Llc | $3,250,000 | Old Republic Title Ins Co | |
| 102 Causeway Owner Llc | $3,250,000 | Old Republic Title Ins Co | |
| 102 Causeway Owner Llc | $3,250,000 | Old Republic Title Ins Co | |
| Shenker Joseph | $950,000 | Evelyn Seidman | |
| Shenker Joseph | $950,000 | Evelyn Seidman | |
| -- | -- | -- | |
| -- | -- | -- | |
| Sattar Abdul | $335,000 | -- | |
| Sattar Abdul | $335,000 | -- |
Source: Public Records
Mortgage History
| Date | Status | Borrower | Loan Amount |
|---|---|---|---|
| Previous Owner | Sattar Abdul | $251,250 |
Source: Public Records
Tax History Compared to Growth
Tax History
| Year | Tax Paid | Tax Assessment Tax Assessment Total Assessment is a certain percentage of the fair market value that is determined by local assessors to be the total taxable value of land and additions on the property. | Land | Improvement |
|---|---|---|---|---|
| 2025 | $20,615 | $1,417 | $838 | $579 |
| 2024 | $7,201 | $1,420 | $840 | $580 |
| 2023 | $17,765 | $1,420 | $840 | $580 |
| 2022 | $17,765 | $1,420 | $840 | $580 |
| 2021 | $16,431 | $1,446 | $963 | $483 |
| 2020 | $12,647 | $1,365 | $715 | $650 |
| 2019 | $13,914 | $1,462 | $718 | $744 |
| 2018 | $14,336 | $1,560 | $0 | $0 |
| 2017 | $10,084 | $1,657 | $723 | $934 |
| 2016 | $14,873 | $1,755 | $690 | $1,065 |
| 2015 | $4,978 | $1,852 | $648 | $1,204 |
| 2014 | $4,978 | $1,852 | $648 | $1,204 |
| 2013 | $4,834 | $1,949 | $682 | $1,267 |
Source: Public Records
Map
Nearby Homes
- 74 Margaret Ave
- 19 Margaret Ave
- 202 Broadway
- 156 Harborview S
- 180 Longwood Crossing
- 345 Broadway
- 233 Narragansett Ave
- 261 Central Ave Unit E4
- 365 Broadway
- 7 Ivy Ln
- 255 Central Ave Unit 202-A
- 255 Central Ave Unit 209 C
- 375 Broadway
- 285 Central Ave Unit D-7
- 285 Central Ave Unit B-4
- 285 Central Ave Unit D6
- 260 Central Ave Unit 135
- 260 Central Ave Unit 430
- 123 Barrett Rd
- 7 Stuyvesant Place