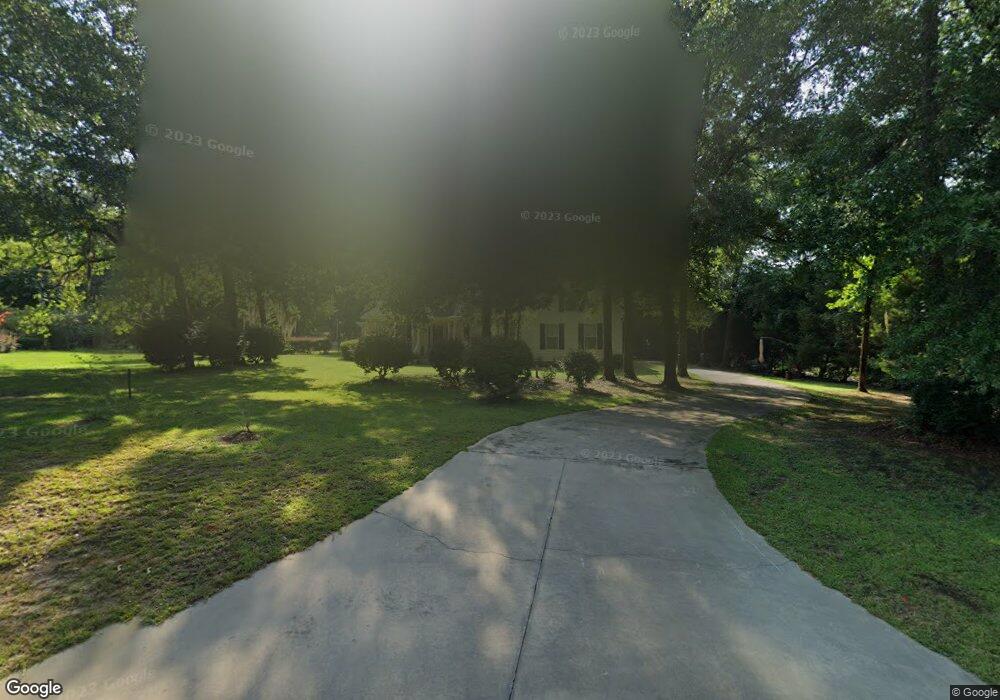
102 Cedar Slough Ct Cordele, GA 31015
Estimated Value: $131,000 - $407,000
4
Beds
3
Baths
2,280
Sq Ft
$134/Sq Ft
Est. Value
About This Home
This home is located at 102 Cedar Slough Ct, Cordele, GA 31015 and is currently estimated at $305,646, approximately $134 per square foot. 102 Cedar Slough Ct is a home located in Crisp County with nearby schools including Crisp County Elementary School, Crisp County Primary School, and Crisp County Middle School.
Ownership History
Date
Name
Owned For
Owner Type
Purchase Details
Closed on
Feb 23, 2010
Sold by
Drake Wanda S
Bought by
Johnson Betty P and Johnson Bobby L
Current Estimated Value
Home Financials for this Owner
Home Financials are based on the most recent Mortgage that was taken out on this home.
Original Mortgage
$100,000
Interest Rate
4.4%
Mortgage Type
New Conventional
Purchase Details
Closed on
Jan 1, 2007
Sold by
Drake Hubert R and Drake Wanda S
Bought by
Drake Hubert R and Drake Wanda S
Purchase Details
Closed on
Apr 14, 2005
Sold by
Derryberry James W
Bought by
Drake Hubert R and Drake Wanda S
Home Financials for this Owner
Home Financials are based on the most recent Mortgage that was taken out on this home.
Original Mortgage
$150,000
Interest Rate
5.88%
Mortgage Type
New Conventional
Purchase Details
Closed on
Jun 5, 2002
Sold by
Folsom Construction
Bought by
Derryberry James W and Derryberry Barbara F
Purchase Details
Closed on
Jan 31, 1992
Bought by
Folsom Construction
Create a Home Valuation Report for This Property
The Home Valuation Report is an in-depth analysis detailing your home's value as well as a comparison with similar homes in the area
Home Values in the Area
Average Home Value in this Area
Purchase History
| Date | Buyer | Sale Price | Title Company |
|---|---|---|---|
| Johnson Betty P | $155,000 | -- | |
| Drake Hubert R | $219,500 | -- | |
| Drake Hubert R | $190,000 | -- | |
| Derryberry James W | $18,000 | -- | |
| Folsom Construction | $100 | -- |
Source: Public Records
Mortgage History
| Date | Status | Borrower | Loan Amount |
|---|---|---|---|
| Closed | Johnson Betty P | $100,000 | |
| Previous Owner | Drake Hubert R | $150,000 |
Source: Public Records
Tax History Compared to Growth
Tax History
| Year | Tax Paid | Tax Assessment Tax Assessment Total Assessment is a certain percentage of the fair market value that is determined by local assessors to be the total taxable value of land and additions on the property. | Land | Improvement |
|---|---|---|---|---|
| 2024 | $1,603 | $74,513 | $7,272 | $67,241 |
| 2023 | $1,592 | $72,146 | $7,272 | $64,874 |
| 2022 | $1,575 | $71,526 | $7,272 | $64,254 |
| 2021 | $1,927 | $64,985 | $7,272 | $57,713 |
| 2020 | $1,467 | $64,985 | $7,272 | $57,713 |
| 2019 | $1,455 | $64,985 | $7,272 | $57,713 |
| 2018 | $1,954 | $79,486 | $6,872 | $72,614 |
| 2017 | $2,438 | $79,293 | $6,872 | $72,421 |
| 2016 | $1,954 | $79,293 | $6,872 | $72,421 |
| 2015 | -- | $79,293 | $6,872 | $72,421 |
| 2014 | -- | $79,293 | $6,872 | $72,421 |
| 2013 | -- | $79,292 | $6,872 | $72,420 |
Source: Public Records
Map
Nearby Homes
- 103 Cedar Slough Ct
- 111 Cedar Creek Rd S
- 251 N Cedar Creek Rd
- 0 Coney Rd S
- 475 N Cedar Creek Rd
- 153 Landing Rd
- 141 Landing Rd
- 850 Scenic Route
- 984 Scenic Route
- Lot 1, 2 Scenic Route
- 580 Scenic Route
- Lot 3,4 Scenic Route
- 228 Cedar Point Cir
- 600 Scenic Route
- 115 Ellis Ct
- 515 Scenic Route
- 466 Scenic Route
- 687 Flintside Dr
- 629 Cork Ferry Rd
- 631 Flintside Dr
- 106 Cedar Slough Ct
- 3 Cedar Slough Ct
- 116 Cedar Slough Ct
- 112 Cedar Slough Ct
- 127 Cedar Slough Ct
- 133 N Cedar Creek Rd
- 135 N Cedar Creek Rd
- 131 N Cedar Creek Rd
- 115 Cedar Slough Ct
- 129 N Cedar Creek Rd
- 137 N Cedar Creek Rd
- 109 Cedar Slough Ct
- 127 N Cedar Creek Rd
- 120 Cedar Slough Ct
- 123 N Cedar Creek Rd
- 124 Cedar Slough Ct
- 143 N Cedar Creek Rd
- 130 Cedar Slough Ct
- 146 N Cedar Creek Rd
- 152 N Cedar Creek Rd