Estimated Value: $528,000 - $574,000
4
Beds
3
Baths
1,920
Sq Ft
$286/Sq Ft
Est. Value
About This Home
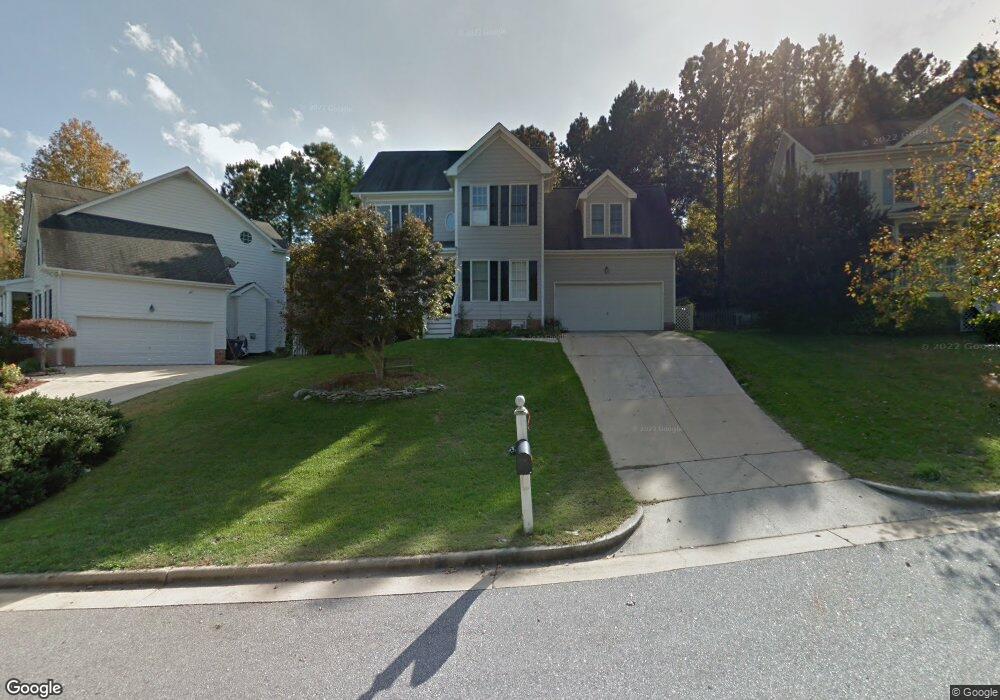
This home is located at 102 Cedar Twig Ct, Apex, NC 27502 and is currently estimated at $548,415, approximately $285 per square foot. 102 Cedar Twig Ct is a home located in Wake County with nearby schools including Scotts Ridge Elementary School, Apex Middle, and Apex High School.
Ownership History
Date
Name
Owned For
Owner Type
Purchase Details
Closed on
Jul 30, 2004
Sold by
Bell Edward K
Bought by
Young Stephen M and Young Kelly L
Current Estimated Value
Home Financials for this Owner
Home Financials are based on the most recent Mortgage that was taken out on this home.
Original Mortgage
$173,700
Interest Rate
5.37%
Mortgage Type
Purchase Money Mortgage
Purchase Details
Closed on
Nov 26, 2003
Sold by
Bell Jacqueline K
Bought by
Bell Edward K
Purchase Details
Closed on
Aug 26, 1998
Sold by
Saymar Custom Homes Inc
Bought by
Bell Edward K
Home Financials for this Owner
Home Financials are based on the most recent Mortgage that was taken out on this home.
Original Mortgage
$135,600
Interest Rate
6.92%
Create a Home Valuation Report for This Property
The Home Valuation Report is an in-depth analysis detailing your home's value as well as a comparison with similar homes in the area
Home Values in the Area
Average Home Value in this Area
Purchase History
| Date | Buyer | Sale Price | Title Company |
|---|---|---|---|
| Young Stephen M | $217,500 | -- | |
| Bell Edward K | -- | -- | |
| Bell Edward K | $170,000 | -- |
Source: Public Records
Mortgage History
| Date | Status | Borrower | Loan Amount |
|---|---|---|---|
| Previous Owner | Young Stephen M | $173,700 | |
| Previous Owner | Bell Edward K | $135,600 |
Source: Public Records
Tax History Compared to Growth
Tax History
| Year | Tax Paid | Tax Assessment Tax Assessment Total Assessment is a certain percentage of the fair market value that is determined by local assessors to be the total taxable value of land and additions on the property. | Land | Improvement |
|---|---|---|---|---|
| 2025 | $4,516 | $514,951 | $180,000 | $334,951 |
| 2024 | $4,415 | $514,951 | $180,000 | $334,951 |
| 2023 | $3,588 | $325,242 | $80,000 | $245,242 |
| 2022 | $3,368 | $325,242 | $80,000 | $245,242 |
| 2021 | $3,240 | $325,242 | $80,000 | $245,242 |
| 2020 | $3,207 | $325,242 | $80,000 | $245,242 |
| 2019 | $3,015 | $263,711 | $80,000 | $183,711 |
| 2018 | $2,840 | $263,711 | $80,000 | $183,711 |
| 2017 | $2,644 | $263,711 | $80,000 | $183,711 |
| 2016 | $2,606 | $263,711 | $80,000 | $183,711 |
| 2015 | $2,508 | $247,666 | $62,000 | $185,666 |
| 2014 | $2,417 | $247,666 | $62,000 | $185,666 |
Source: Public Records
Map
Nearby Homes
- 104 Pine Tag Ct
- 428 Heritage Village Ln
- 441 Heritage Village Ln
- 448 Heritage Village Ln
- 460 Heritage Village Ln
- 1773 Town Home Dr
- 402 Village Loop Dr
- 541 Village Loop Dr
- 1131 Bungalow Park Dr
- 1910 Woodall Crest Dr
- 1880 Woodall Crest Dr
- 1042 Mica Lamp Ct
- 1844 Woodall Crest Dr
- 103 Garden Side Way
- 1701 Barrett Run Trail
- 209 Homegate Cir
- 1726 Barrett Run Trail
- 0 Jb Morgan Rd Unit 10051948
- 3014 Silky Dogwood Trail
- 1811 Aspen River Ln
- 100 Cedar Twig Ct
- 104 Cedar Twig Ct
- 128 Cedar Twig Ct
- 203 Acorn Hill Ln
- 103 Pine Knob Ct
- 301 Acorn Hill Ln
- 106 Cedar Twig Ct
- 201 Acorn Hill Ln
- 105 Pine Knob Ct
- 103 Cedar Twig Ct
- 107 Cedar Twig Ct
- 303 Acorn Hill Ln
- 206 Acorn Hill Ln
- 204 Acorn Hill Ln
- 210 Scotts Ridge Trail
- 208 Acorn Hill Ln
- 300 Scotts Ridge Trail
- 202 Acorn Hill Ln
- 300 Acorn Hill Ln
- 302 Scotts Ridge Trail