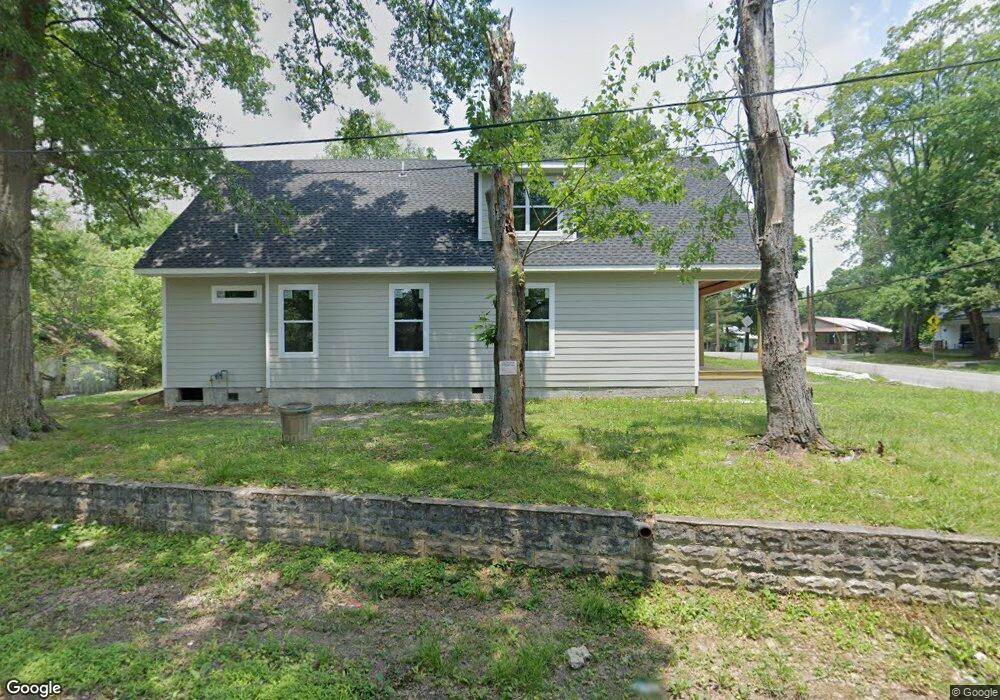
102 Clark St Chickamauga, GA 30707
Estimated Value: $164,419 - $234,000
2
Beds
1
Bath
966
Sq Ft
$206/Sq Ft
Est. Value
About This Home
This home is located at 102 Clark St, Chickamauga, GA 30707 and is currently estimated at $199,355, approximately $206 per square foot. 102 Clark St is a home located in Walker County with nearby schools including Gordon Lee Middle School, Gordon Lee High School, and Oakwood Christian Academy.
Ownership History
Date
Name
Owned For
Owner Type
Purchase Details
Closed on
Oct 15, 2004
Sold by
Ingle Troy L and Ingle Deborah H
Bought by
Huey Tara N
Current Estimated Value
Purchase Details
Closed on
Nov 29, 2000
Sold by
Jones Daniel J and Jones Iris D
Bought by
Ingle Troy L and Ingle Deborah H
Purchase Details
Closed on
Apr 27, 1995
Sold by
Jones Daniel J
Bought by
Jones Daniel J and Jones Iris D
Purchase Details
Closed on
Oct 22, 1979
Sold by
Jones D B
Bought by
Jones Daniel J
Purchase Details
Closed on
Oct 1, 1952
Bought by
Jones D B
Create a Home Valuation Report for This Property
The Home Valuation Report is an in-depth analysis detailing your home's value as well as a comparison with similar homes in the area
Home Values in the Area
Average Home Value in this Area
Purchase History
| Date | Buyer | Sale Price | Title Company |
|---|---|---|---|
| Huey Tara N | $77,900 | -- | |
| Ingle Troy L | $55,000 | -- | |
| Jones Daniel J | -- | -- | |
| Jones Daniel J | -- | -- | |
| Jones D B | -- | -- |
Source: Public Records
Tax History Compared to Growth
Tax History
| Year | Tax Paid | Tax Assessment Tax Assessment Total Assessment is a certain percentage of the fair market value that is determined by local assessors to be the total taxable value of land and additions on the property. | Land | Improvement |
|---|---|---|---|---|
| 2024 | $1,329 | $57,470 | $28,000 | $29,470 |
| 2023 | $1,332 | $55,978 | $28,000 | $27,978 |
| 2022 | $492 | $41,847 | $17,920 | $23,927 |
| 2021 | $468 | $33,008 | $17,920 | $15,088 |
| 2020 | $486 | $31,337 | $17,920 | $13,417 |
| 2019 | $486 | $31,337 | $17,920 | $13,417 |
| 2018 | $411 | $31,337 | $17,920 | $13,417 |
| 2017 | $591 | $31,337 | $17,920 | $13,417 |
| 2016 | $451 | $31,337 | $17,920 | $13,417 |
| 2015 | $439 | $28,789 | $6,240 | $22,549 |
| 2014 | $345 | $28,789 | $6,240 | $22,549 |
| 2013 | -- | $28,788 | $6,240 | $22,548 |
Source: Public Records
Map
Nearby Homes
- 301 Clebourne Ave
- 111 Clebourne Ave
- 0 Pearl Ave Unit 1523358
- 205 Wheeler Ave
- 206 Wheeler Ave
- 305 Gordon St
- 107 Wilder Ave
- 201 E Tennant Cir
- 74 Cove Rd
- 80 Cove Rd
- 138 Dana Ln
- 16 Euclid Ave
- 232 E Tennant Cir
- 130 Krystal Dr
- 801 Thomas Ave
- 54 Mill Springs
- 0 Bear Paw Trail Unit 1519259
- 0 Bear Paw Trail Unit RTC2980469
- 17 W Fork Ln
- 43 Hidden Hills Dr