Estimated Value: $140,000 - $218,000
4
Beds
2
Baths
1,542
Sq Ft
$122/Sq Ft
Est. Value
About This Home
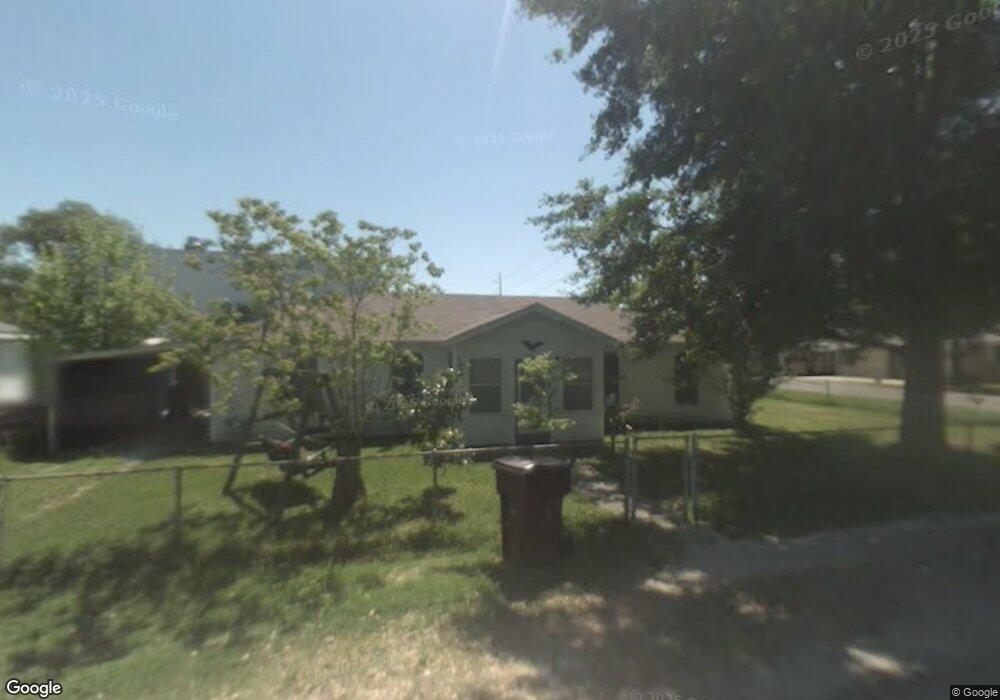
This home is located at 102 Clayton Dr, Norco, LA 70079 and is currently estimated at $188,410, approximately $122 per square foot. 102 Clayton Dr is a home located in St. Charles Parish with nearby schools including Norco Elementary School, Destrehan High School, and Harry M. Hurst Middle School.
Ownership History
Date
Name
Owned For
Owner Type
Purchase Details
Closed on
Jun 29, 2012
Sold by
Powerhouse Properties & Investments Llc
Bought by
Allen Marcus E
Current Estimated Value
Home Financials for this Owner
Home Financials are based on the most recent Mortgage that was taken out on this home.
Original Mortgage
$140,816
Outstanding Balance
$97,845
Interest Rate
3.81%
Mortgage Type
New Conventional
Estimated Equity
$90,565
Purchase Details
Closed on
Aug 4, 2011
Sold by
Guidry Earline T and Duhon Dianne T
Bought by
Powerhouse Properties & Investments Llc
Create a Home Valuation Report for This Property
The Home Valuation Report is an in-depth analysis detailing your home's value as well as a comparison with similar homes in the area
Home Values in the Area
Average Home Value in this Area
Purchase History
| Date | Buyer | Sale Price | Title Company |
|---|---|---|---|
| Allen Marcus E | $136,000 | Choice Title | |
| Powerhouse Properties & Investments Llc | $76,000 | None Available |
Source: Public Records
Mortgage History
| Date | Status | Borrower | Loan Amount |
|---|---|---|---|
| Open | Allen Marcus E | $140,816 |
Source: Public Records
Tax History Compared to Growth
Tax History
| Year | Tax Paid | Tax Assessment Tax Assessment Total Assessment is a certain percentage of the fair market value that is determined by local assessors to be the total taxable value of land and additions on the property. | Land | Improvement |
|---|---|---|---|---|
| 2024 | $705 | $14,490 | $3,950 | $10,540 |
| 2023 | $716 | $11,437 | $3,110 | $8,327 |
| 2022 | $1,333 | $11,437 | $3,110 | $8,327 |
| 2021 | $1,034 | $8,794 | $2,799 | $5,995 |
| 2020 | $1,344 | $11,437 | $3,110 | $8,327 |
| 2019 | $1,175 | $9,936 | $2,380 | $7,556 |
| 2018 | $1,166 | $9,936 | $2,380 | $7,556 |
| 2017 | $1,166 | $9,936 | $2,380 | $7,556 |
| 2016 | $1,171 | $9,936 | $2,380 | $7,556 |
| 2015 | $556 | $12,240 | $954 | $11,286 |
| 2014 | $535 | $12,240 | $954 | $11,286 |
| 2013 | $537 | $12,240 | $954 | $11,286 |
Source: Public Records
Map
Nearby Homes