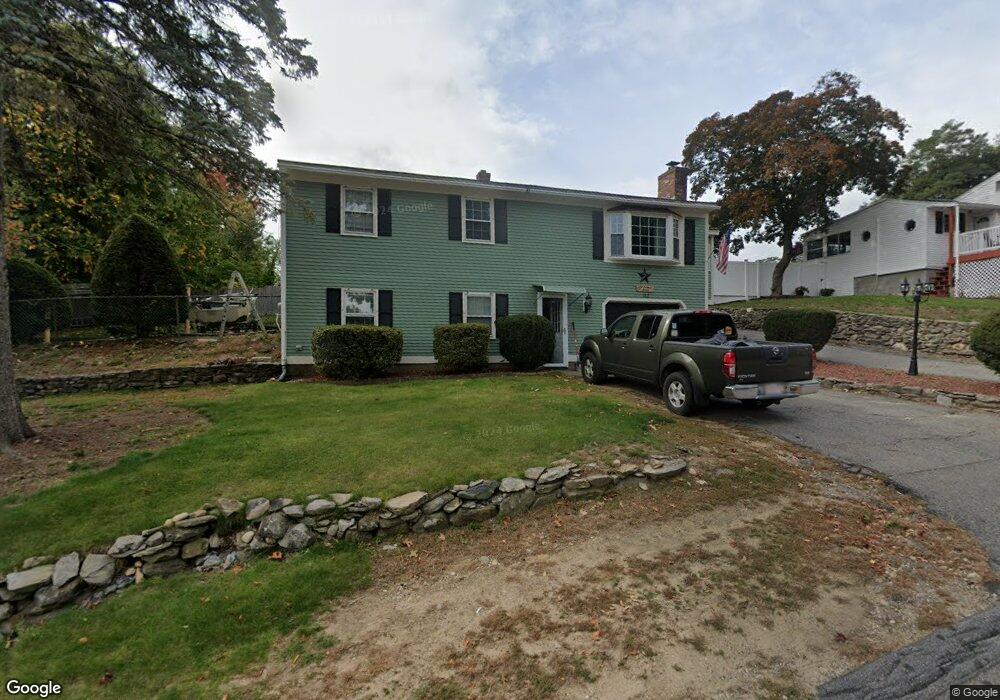
102 Connors St Fitchburg, MA 01420
South Fitchburg NeighborhoodEstimated Value: $390,000 - $400,000
3
Beds
1
Bath
1,184
Sq Ft
$333/Sq Ft
Est. Value
About This Home
This home is located at 102 Connors St, Fitchburg, MA 01420 and is currently estimated at $394,164, approximately $332 per square foot. 102 Connors St is a home located in Worcester County with nearby schools including South Street Elementary School, Reingold Elementary School, and Crocker Elementary School.
Ownership History
Date
Name
Owned For
Owner Type
Purchase Details
Closed on
Aug 15, 2025
Sold by
Miner Linda and Miner Peter
Bought by
Hitchcock Alan J and Hitchcock Tina M
Current Estimated Value
Home Financials for this Owner
Home Financials are based on the most recent Mortgage that was taken out on this home.
Original Mortgage
$373,117
Outstanding Balance
$372,791
Interest Rate
6.67%
Mortgage Type
FHA
Estimated Equity
$21,373
Purchase Details
Closed on
May 15, 1998
Sold by
Guillette Nelson R and Guillette Marilyn A
Bought by
Miner Peter R and Miner Linda M
Home Financials for this Owner
Home Financials are based on the most recent Mortgage that was taken out on this home.
Original Mortgage
$90,000
Interest Rate
7.08%
Mortgage Type
Purchase Money Mortgage
Create a Home Valuation Report for This Property
The Home Valuation Report is an in-depth analysis detailing your home's value as well as a comparison with similar homes in the area
Home Values in the Area
Average Home Value in this Area
Purchase History
| Date | Buyer | Sale Price | Title Company |
|---|---|---|---|
| Hitchcock Alan J | $380,000 | -- | |
| Hitchcock Alan J | $380,000 | -- | |
| Miner Peter R | $123,000 | -- | |
| Miner Peter R | $123,000 | -- |
Source: Public Records
Mortgage History
| Date | Status | Borrower | Loan Amount |
|---|---|---|---|
| Open | Hitchcock Alan J | $373,117 | |
| Closed | Hitchcock Alan J | $373,117 | |
| Previous Owner | Miner Peter R | $140,000 | |
| Previous Owner | Miner Peter R | $90,000 |
Source: Public Records
Tax History Compared to Growth
Tax History
| Year | Tax Paid | Tax Assessment Tax Assessment Total Assessment is a certain percentage of the fair market value that is determined by local assessors to be the total taxable value of land and additions on the property. | Land | Improvement |
|---|---|---|---|---|
| 2025 | $4,299 | $318,200 | $105,900 | $212,300 |
| 2024 | $4,283 | $289,200 | $79,000 | $210,200 |
| 2023 | $4,226 | $263,800 | $70,200 | $193,600 |
| 2022 | $4,168 | $236,700 | $67,700 | $169,000 |
| 2021 | $4,960 | $216,400 | $60,200 | $156,200 |
| 2020 | $3,842 | $200,900 | $55,200 | $145,700 |
| 2019 | $4,703 | $194,400 | $66,500 | $127,900 |
| 2018 | $3,790 | $180,400 | $61,500 | $118,900 |
| 2017 | $4,337 | $165,600 | $57,700 | $107,900 |
| 2016 | $3,356 | $158,100 | $56,400 | $101,700 |
| 2015 | $3,218 | $155,600 | $55,200 | $100,400 |
| 2014 | $3,088 | $155,700 | $52,700 | $103,000 |
Source: Public Records
Map
Nearby Homes
- 1295 Water St
- 20 Pleasantview Ave
- 1220 Water St
- 31 Bemis Rd
- 35 Bemis Rd
- 20 Oregon Ave
- 29 Bamford Ave
- 30 Palm St
- 2 Arden Mills Way Unit 2210
- 0 Palm St
- 156 Belmont St
- 43 Saint Anthony St
- 0 Summer St
- 19 Mount Carmel St
- 535 South St Unit 4-2A
- 535 South St Unit 14-2A
- 59 Kenniston St
- 505 Old St S
- 55 Smith St
- 15 Clyde St
- 112 Connors St
- 92 Connors St
- 56 Dailey Terrace
- 93 Connors St
- 107 Connors St
- 44 Dailey Terrace
- 122 Connors St
- 88 Connors St
- 117 Connors St
- 62 Dailey Terrace
- 76 Longedge Ave
- 75 Connors St
- 34 Dailey Terrace
- 127 Connors St
- 69 Dailey Terrace
- 132 Connors St
- 74 Connors St
- 70 Dailey Terrace
- 75 Longedge Ave
- 45 Dailey Terrace