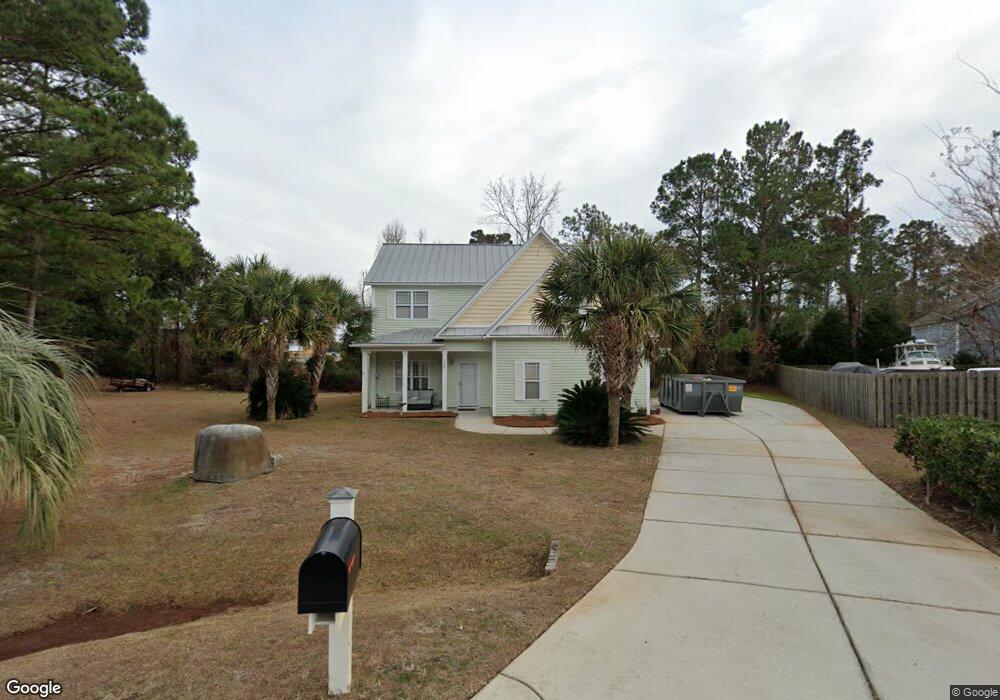
102 Date Palm Ct Hampstead, NC 28443
Estimated Value: $458,499 - $503,000
4
Beds
3
Baths
2,105
Sq Ft
$230/Sq Ft
Est. Value
About This Home
This home is located at 102 Date Palm Ct, Hampstead, NC 28443 and is currently estimated at $484,125, approximately $229 per square foot. 102 Date Palm Ct is a home located in Pender County with nearby schools including South Topsail Elementary School, Topsail Middle School, and Topsail High School.
Ownership History
Date
Name
Owned For
Owner Type
Purchase Details
Closed on
Feb 3, 2022
Sold by
Elam Family Llc
Bought by
Ctmg Holdings Llc
Current Estimated Value
Purchase Details
Closed on
Jul 20, 2021
Sold by
Elam Family Llc
Bought by
Ctmg Holdings Llc
Purchase Details
Closed on
Nov 13, 2008
Sold by
Elam Charles M
Bought by
Elam Family Llc
Purchase Details
Closed on
Jan 20, 2006
Sold by
Southeast Custom Homes Inc
Bought by
Elam Charles M
Purchase Details
Closed on
Jul 26, 2005
Sold by
Colorado Coastal Development Llc
Bought by
Southeast Custom Homes Inc
Home Financials for this Owner
Home Financials are based on the most recent Mortgage that was taken out on this home.
Original Mortgage
$35,200
Interest Rate
5.59%
Mortgage Type
Future Advance Clause Open End Mortgage
Create a Home Valuation Report for This Property
The Home Valuation Report is an in-depth analysis detailing your home's value as well as a comparison with similar homes in the area
Home Values in the Area
Average Home Value in this Area
Purchase History
| Date | Buyer | Sale Price | Title Company |
|---|---|---|---|
| Ctmg Holdings Llc | -- | Bailey & Busby Pllc | |
| Ctmg Holdings Llc | -- | None Available | |
| Elam Family Llc | $325,000 | -- | |
| Elam Charles M | $163,500 | -- | |
| Southeast Custom Homes Inc | $44,000 | -- |
Source: Public Records
Mortgage History
| Date | Status | Borrower | Loan Amount |
|---|---|---|---|
| Previous Owner | Southeast Custom Homes Inc | $35,200 |
Source: Public Records
Tax History Compared to Growth
Tax History
| Year | Tax Paid | Tax Assessment Tax Assessment Total Assessment is a certain percentage of the fair market value that is determined by local assessors to be the total taxable value of land and additions on the property. | Land | Improvement |
|---|---|---|---|---|
| 2024 | $2,744 | $275,064 | $54,653 | $220,411 |
| 2023 | $2,744 | $275,064 | $54,653 | $220,411 |
| 2022 | $2,400 | $275,064 | $54,653 | $220,411 |
| 2021 | $2,400 | $275,064 | $54,653 | $220,411 |
| 2020 | $2,400 | $275,064 | $54,653 | $220,411 |
| 2019 | $932 | $98,735 | $54,653 | $44,082 |
| 2018 | $2,562 | $268,381 | $50,000 | $218,381 |
| 2017 | $2,562 | $268,381 | $50,000 | $218,381 |
| 2016 | $2,535 | $268,381 | $50,000 | $218,381 |
| 2015 | $2,500 | $268,381 | $50,000 | $218,381 |
| 2014 | $1,970 | $268,381 | $50,000 | $218,381 |
| 2013 | -- | $268,381 | $50,000 | $218,381 |
| 2012 | -- | $268,381 | $50,000 | $218,381 |
Source: Public Records
Map
Nearby Homes
- 714 Hughes Rd
- 655 Hughes Rd
- 84 Capital Dr
- 648 Hughes Rd
- 802 Sound View Dr
- 131 Turner Way
- 1031 Washington Acres Rd
- 153 Dogwood Ln
- 239 Seneca Reef Dr
- 314 E Rolling Meadows Rd
- 119 Waters Edge
- 33 Medina Ct
- 522 Hughes Rd
- 444 E Creekview Dr
- 76 Hughes Rd
- 60 Bluenose Ln
- 10 Abaco Way
- 613 Hughes Rd
- 509 Center Dr
- 75 Twisted Oak Ct
- 104 Date Palm Ct
- 28 Date Palm Ct
- 100 Date Palm Ct
- 205 Palm Cottage Dr
- 720 Hughes Rd
- 103 Date Palm Ct
- 718 Hughes Rd
- 705 Pine St
- 716 Hughes Rd
- 139 Palm Cottage Dr
- 202 Palm Cottage Dr
- 204 Palm Cottage Dr
- 137 Palm Cottage Dr
- 101 Fielding Terrace Ct
- 206 Palm Cottage Dr
- 703 Pine St
- 706 Pine St
- 710 Hughes Rd
- 135 Palm Cottage Dr
- 713 Hughes Rd