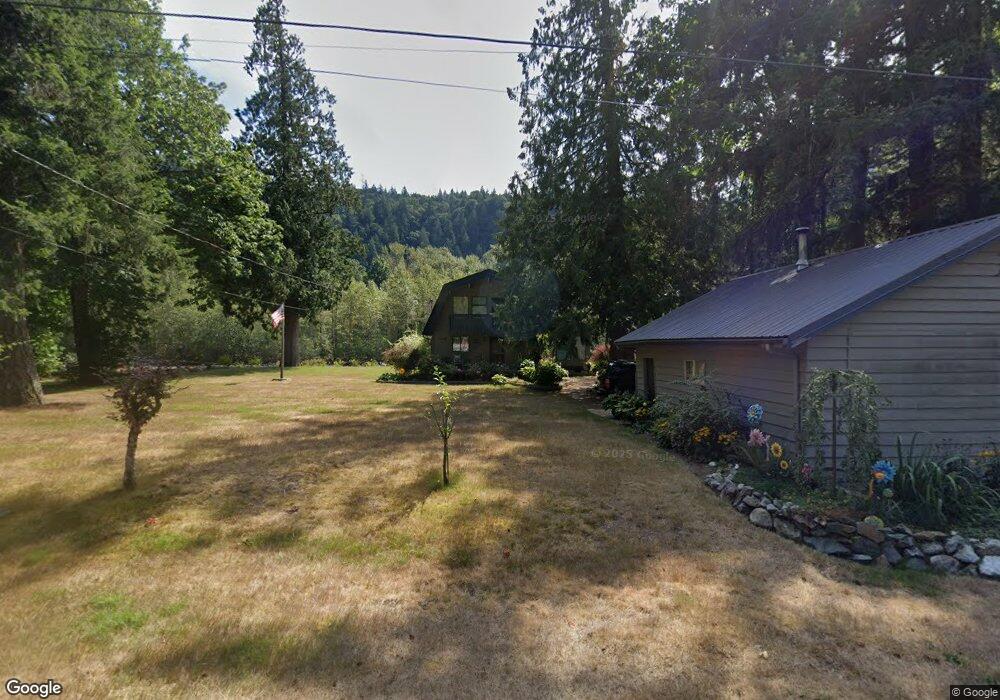
102 E Avenue A Index, WA 98256
Estimated Value: $300,000 - $404,000
1
Bed
1
Bath
576
Sq Ft
$621/Sq Ft
Est. Value
About This Home
This home is located at 102 E Avenue A, Index, WA 98256 and is currently estimated at $357,932, approximately $621 per square foot. 102 E Avenue A is a home with nearby schools including Index Elementary School.
Ownership History
Date
Name
Owned For
Owner Type
Purchase Details
Closed on
Nov 2, 2016
Sold by
Ellinger Michael J and Ellinger Cynthia L
Bought by
Rastegar Saeid and Rastegar Beatrice
Current Estimated Value
Purchase Details
Closed on
Feb 21, 2012
Sold by
Ellinger Michael J and Ellinger Cynthia L
Bought by
Rastegar Saeid and Rastegar Beatrice
Home Financials for this Owner
Home Financials are based on the most recent Mortgage that was taken out on this home.
Original Mortgage
$72,000
Interest Rate
3.83%
Mortgage Type
Seller Take Back
Purchase Details
Closed on
Jul 25, 2006
Sold by
Grife Erin and Grife Michael
Bought by
Ellinger Michael J and Ellinger Cynthia L
Purchase Details
Closed on
Sep 17, 1997
Sold by
Flood Michael J and Flood Judi
Bought by
Clary Erin and Grife Michael
Home Financials for this Owner
Home Financials are based on the most recent Mortgage that was taken out on this home.
Original Mortgage
$51,000
Interest Rate
7.45%
Mortgage Type
Seller Take Back
Create a Home Valuation Report for This Property
The Home Valuation Report is an in-depth analysis detailing your home's value as well as a comparison with similar homes in the area
Purchase History
| Date | Buyer | Sale Price | Title Company |
|---|---|---|---|
| Rastegar Saeid | $77,000 | None Available | |
| Rastegar Saeid | $77,000 | None Available | |
| Ellinger Michael J | $63,000 | Pnwt | |
| Clary Erin | $58,000 | -- |
Source: Public Records
Mortgage History
| Date | Status | Borrower | Loan Amount |
|---|---|---|---|
| Previous Owner | Rastegar Saeid | $72,000 | |
| Previous Owner | Clary Erin | $51,000 |
Source: Public Records
Tax History
| Year | Tax Paid | Tax Assessment Tax Assessment Total Assessment is a certain percentage of the fair market value that is determined by local assessors to be the total taxable value of land and additions on the property. | Land | Improvement |
|---|---|---|---|---|
| 2026 | $2,017 | $340,600 | $291,500 | $49,100 |
| 2025 | $1,817 | $331,700 | $278,800 | $52,900 |
| 2024 | $1,817 | $300,400 | $247,500 | $52,900 |
| 2023 | $1,655 | $297,400 | $236,400 | $61,000 |
| 2022 | $1,417 | $206,900 | $157,000 | $49,900 |
| 2020 | $1,252 | $168,400 | $127,000 | $41,400 |
| 2019 | $1,229 | $160,800 | $122,000 | $38,800 |
| 2018 | $1,182 | $124,700 | $88,000 | $36,700 |
| 2017 | $1,019 | $112,000 | $75,000 | $37,000 |
| 2016 | $878 | $92,400 | $70,000 | $22,400 |
| 2015 | $1,183 | $116,100 | $61,000 | $55,100 |
| 2013 | $535 | $51,600 | $42,000 | $9,600 |
Source: Public Records
Map
Nearby Homes
- 49 Xx Highway 2
- 0 00381300002900 Unit NWM2456608
- 44525 Pine Rd
- 44331 Pine Rd
- 17631 442nd Dr SE
- 44212 Fir Rd
- 15305 Index-Galena Rd
- 17818 433rd Ave SE
- 68350 U S Highway 2
- 63631 194th Place NE
- 16406 May Creek Rd
- 42806 169th St SE
- 63645 NE 190th St
- 15528 May Creek Rd
- 15322 May Creek Rd
- 16131 426th Ave SE
- 18242 643rd Ave NE
- 427 XX 156th St SE
- 16609 415th Ave SE
- 64458 NE 180th St
Your Personal Tour Guide
Ask me questions while you tour the home.