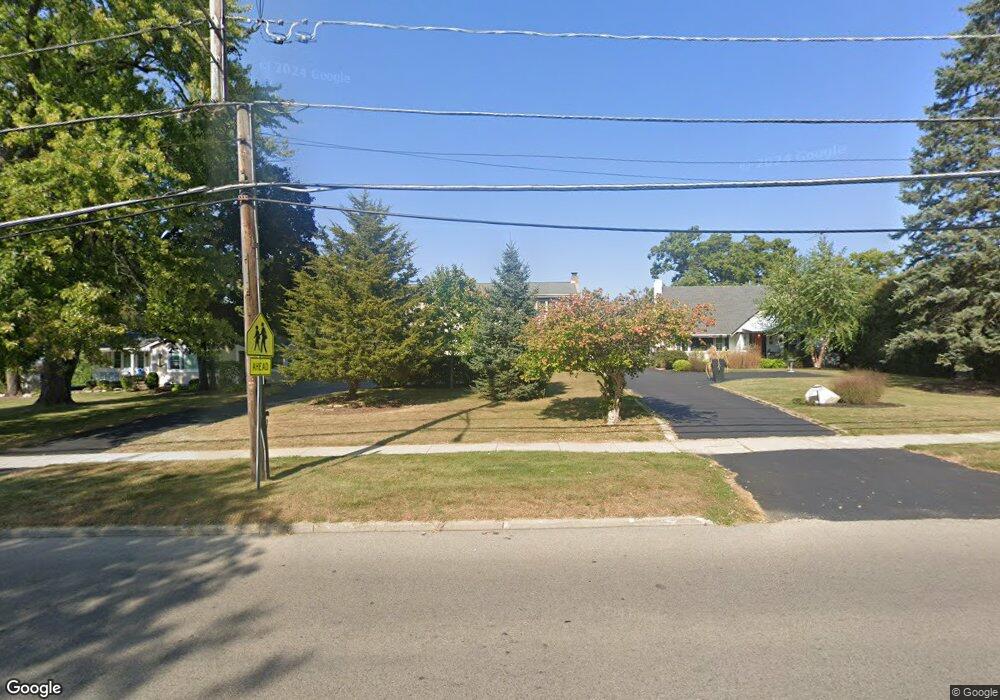
102 E Grand Ave Fox Lake, IL 60020
Estimated Value: $473,211 - $646,000
4
Beds
3
Baths
3,023
Sq Ft
$178/Sq Ft
Est. Value
About This Home
This home is located at 102 E Grand Ave, Fox Lake, IL 60020 and is currently estimated at $538,553, approximately $178 per square foot. 102 E Grand Ave is a home located in Lake County with nearby schools including Lotus Elementary School, Stanton Middle School, and Grant Community High School.
Ownership History
Date
Name
Owned For
Owner Type
Purchase Details
Closed on
Feb 29, 2012
Sold by
Otway Donald E and Otway Marge A
Bought by
Robinson Charles and Robinson Vicki
Current Estimated Value
Home Financials for this Owner
Home Financials are based on the most recent Mortgage that was taken out on this home.
Original Mortgage
$153,000
Outstanding Balance
$105,150
Interest Rate
3.88%
Mortgage Type
New Conventional
Estimated Equity
$433,403
Purchase Details
Closed on
Sep 20, 2010
Sold by
Homesales Inc
Bought by
Otway Donald E and Otway Marge A
Purchase Details
Closed on
Oct 16, 2009
Sold by
Bransley
Bought by
Homesales Inc
Purchase Details
Closed on
Aug 20, 1997
Sold by
Strauss James B and Strauss Alice J
Bought by
Bransley John M
Home Financials for this Owner
Home Financials are based on the most recent Mortgage that was taken out on this home.
Original Mortgage
$124,900
Interest Rate
7.3%
Create a Home Valuation Report for This Property
The Home Valuation Report is an in-depth analysis detailing your home's value as well as a comparison with similar homes in the area
Home Values in the Area
Average Home Value in this Area
Purchase History
| Date | Buyer | Sale Price | Title Company |
|---|---|---|---|
| Robinson Charles | $255,000 | Ct | |
| Otway Donald E | $93,500 | Wheatland Title Guaranty | |
| Homesales Inc | -- | None Available | |
| Bransley John M | $130,000 | Chicago Title Insurance Co |
Source: Public Records
Mortgage History
| Date | Status | Borrower | Loan Amount |
|---|---|---|---|
| Open | Robinson Charles | $153,000 | |
| Previous Owner | Bransley John M | $124,900 |
Source: Public Records
Tax History
| Year | Tax Paid | Tax Assessment Tax Assessment Total Assessment is a certain percentage of the fair market value that is determined by local assessors to be the total taxable value of land and additions on the property. | Land | Improvement |
|---|---|---|---|---|
| 2024 | $9,604 | $135,933 | $17,353 | $118,580 |
| 2023 | $9,680 | $109,440 | $16,348 | $93,092 |
| 2022 | $9,680 | $106,399 | $16,502 | $89,897 |
| 2021 | $9,395 | $100,292 | $15,555 | $84,737 |
| 2020 | $9,416 | $98,859 | $15,333 | $83,526 |
| 2019 | $8,995 | $94,802 | $14,704 | $80,098 |
| 2018 | $9,286 | $94,808 | $22,479 | $72,329 |
| 2017 | $8,883 | $87,631 | $20,777 | $66,854 |
| 2016 | $8,968 | $80,145 | $19,002 | $61,143 |
| 2015 | $8,553 | $74,790 | $17,732 | $57,058 |
| 2014 | $8,450 | $81,270 | $17,793 | $63,477 |
| 2012 | $8,697 | $79,219 | $18,540 | $60,679 |
Source: Public Records
Map
Nearby Homes
- 127 E Grand Ave
- 35 Medinah Ave
- 31 Lakeside Ln
- 21 Hillside Dr
- 11 Highview Ave
- 176 E Grand Ave
- 10 S Maple Ave
- 67 Woodhills Bay Rd
- 53 Mariner Ln Unit 11C
- 61 Highview Ave
- 50 N Lake Ave
- 235 E Grand Ave
- 37 Nippersink Rd
- 34 Elm Ave
- 69 White Oaks Rd
- 49 N Lake Ave
- 38 Lippincott Rd
- 10 Matts Rd
- 79 Maude Ave Unit E
- 36 S Pistakee Lake Rd
Your Personal Tour Guide
Ask me questions while you tour the home.