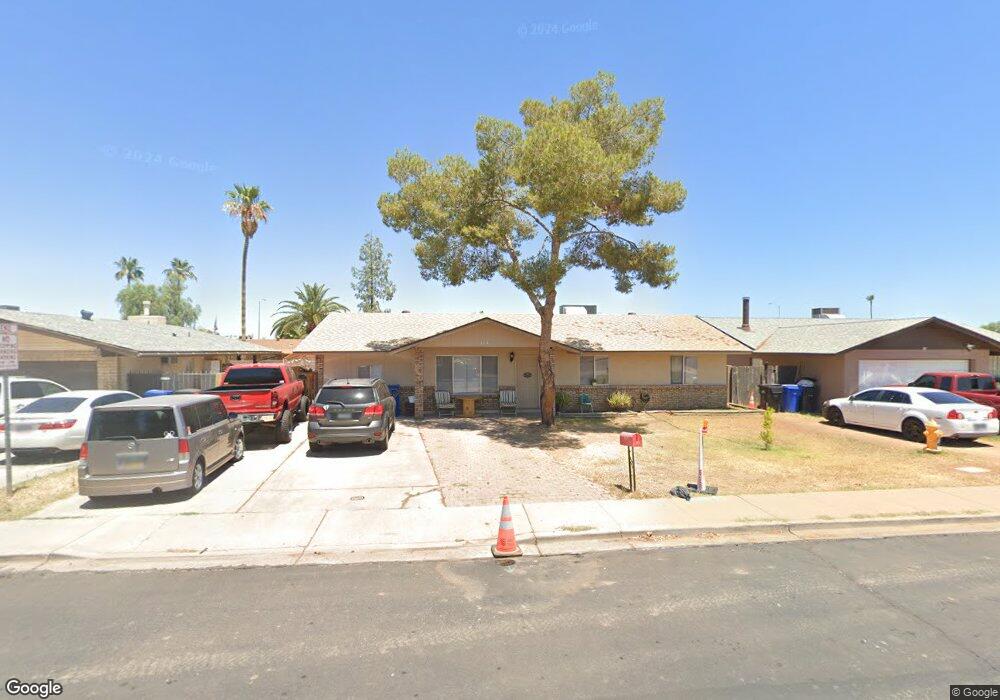
102 E Mclellan Rd Mesa, AZ 85201
North Center NeighborhoodEstimated Value: $327,234 - $424,000
Studio
2
Baths
1,511
Sq Ft
$260/Sq Ft
Est. Value
About This Home
This home is located at 102 E Mclellan Rd, Mesa, AZ 85201 and is currently estimated at $392,559, approximately $259 per square foot. 102 E Mclellan Rd is a home located in Maricopa County with nearby schools including Franklin at Brimhall Elementary School, Kerr Elementary School, and Franklin West Elementary School.
Ownership History
Date
Name
Owned For
Owner Type
Purchase Details
Closed on
Oct 24, 2017
Sold by
Sby 2014 1 Borrower Llc
Bought by
Tah Ms Borrower Llc
Current Estimated Value
Home Financials for this Owner
Home Financials are based on the most recent Mortgage that was taken out on this home.
Original Mortgage
$372,582,095
Outstanding Balance
$310,876,532
Interest Rate
3.78%
Mortgage Type
Construction
Estimated Equity
-$310,483,973
Purchase Details
Closed on
Aug 12, 2014
Sold by
2012-B Property Holdings Llc
Bought by
Sby 2014-1 Borrower Llc
Purchase Details
Closed on
Oct 3, 2012
Sold by
Olso Arlo W and Olso Marlene A
Bought by
2012-B Property Holdings Llc
Purchase Details
Closed on
Sep 30, 2010
Sold by
Olson Marlene A
Bought by
Olson Andrew W
Create a Home Valuation Report for This Property
The Home Valuation Report is an in-depth analysis detailing your home's value as well as a comparison with similar homes in the area
Home Values in the Area
Average Home Value in this Area
Purchase History
| Date | Buyer | Sale Price | Title Company |
|---|---|---|---|
| Tah Ms Borrower Llc | -- | None Available | |
| Sby 2014-1 Borrower Llc | -- | None Available | |
| 2012-B Property Holdings Llc | $80,000 | None Available | |
| Olson Andrew W | -- | None Available |
Source: Public Records
Mortgage History
| Date | Status | Borrower | Loan Amount |
|---|---|---|---|
| Open | Tah Ms Borrower Llc | $372,582,095 |
Source: Public Records
Tax History
| Year | Tax Paid | Tax Assessment Tax Assessment Total Assessment is a certain percentage of the fair market value that is determined by local assessors to be the total taxable value of land and additions on the property. | Land | Improvement |
|---|---|---|---|---|
| 2025 | $1,203 | $12,195 | -- | -- |
| 2024 | $1,207 | $11,614 | -- | -- |
| 2023 | $1,207 | $27,630 | $5,520 | $22,110 |
| 2022 | $1,182 | $21,170 | $4,230 | $16,940 |
| 2021 | $1,196 | $17,860 | $3,570 | $14,290 |
| 2020 | $1,181 | $16,480 | $3,290 | $13,190 |
| 2019 | $1,103 | $15,480 | $3,090 | $12,390 |
| 2018 | $1,059 | $13,820 | $2,760 | $11,060 |
| 2017 | $1,027 | $12,220 | $2,440 | $9,780 |
| 2016 | $1,008 | $10,550 | $2,110 | $8,440 |
| 2015 | $948 | $9,110 | $1,820 | $7,290 |
Source: Public Records
Map
Nearby Homes
- 1505 N Center St Unit 218
- 1505 N Center St Unit 115
- 22 W Ingram St
- 250 E Hillside St
- 38 W Hillview St
- 1636 N Wilbur
- 51 W Hillview St
- 309 E Ingram St
- 222 W Ivyglen St
- 1522 North Spring
- 1509 North Spring
- 1341 N Pomeroy
- 1759 N Spring Cir
- 1437 N Lesueur
- 1904 N Lebaron
- 2042 N Center St
- 537 E Hackamore St
- 1112 N Center St
- 30 E Brown Rd Unit 2040
- 30 E Brown Rd Unit 2070
- 108 E Mclellan Rd
- 60 E Mclellan Rd
- 101 E Indigo St
- 59 E Indigo St
- 107 E Indigo St
- 114 E Mclellan Rd
- 54 E Mclellan Rd
- 53 E Indigo St
- 113 E Indigo St
- 120 E Mclellan Rd Unit 1
- 46 E Mclellan Rd
- 47 E Indigo St
- 119 E Indigo St
- 100XX E Indigo St Unit C
- 40 E Mclellan Rd
- 102 E Indigo St
- 60 E Indigo St
- 106 E Indigo St
- 39 E Indigo St
- 127 E Indigo St
Your Personal Tour Guide
Ask me questions while you tour the home.