Estimated Value: $152,000 - $189,000
4
Beds
1
Bath
2,965
Sq Ft
$58/Sq Ft
Est. Value
About This Home
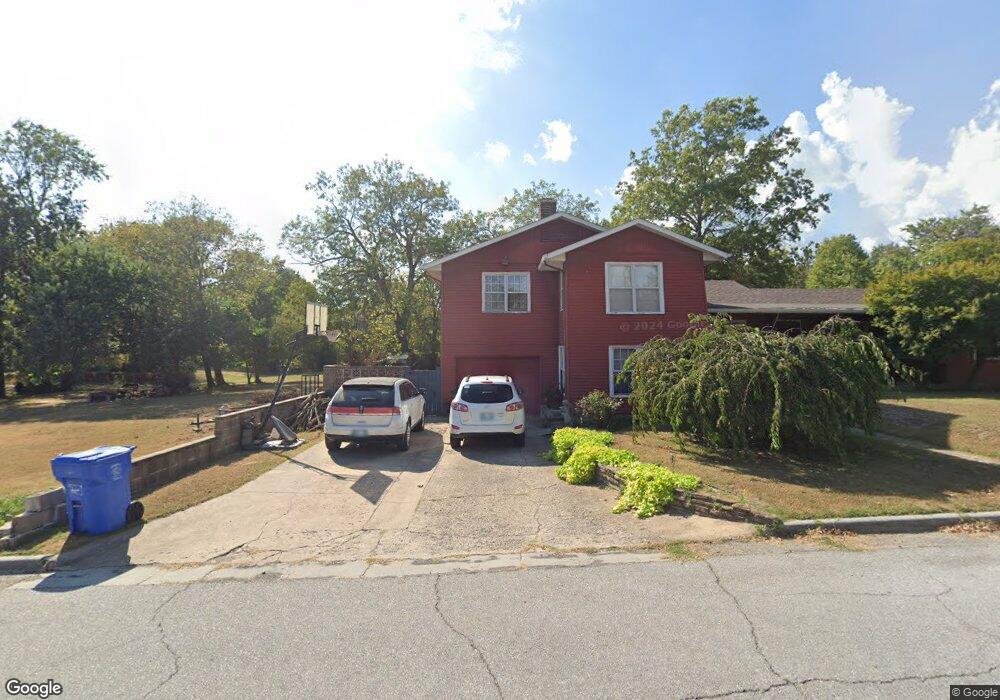
This home is located at 102 E St SW, Miami, OK 74354 and is currently estimated at $170,516, approximately $57 per square foot. 102 E St SW is a home located in Ottawa County with nearby schools including Miami High School and Mt. Olive Lutheran School.
Ownership History
Date
Name
Owned For
Owner Type
Purchase Details
Closed on
Sep 25, 2007
Sold by
Batt Alan and Batt Andrea
Bought by
Hillestad John D and Hillestad Debbie S
Current Estimated Value
Home Financials for this Owner
Home Financials are based on the most recent Mortgage that was taken out on this home.
Original Mortgage
$80,000
Interest Rate
6.66%
Mortgage Type
FHA
Purchase Details
Closed on
Dec 19, 2006
Sold by
Paxson James T and Paxson Shanon E
Bought by
Batt Alan and Batt Andrea
Home Financials for this Owner
Home Financials are based on the most recent Mortgage that was taken out on this home.
Original Mortgage
$85,000
Interest Rate
6.31%
Mortgage Type
New Conventional
Purchase Details
Closed on
Sep 23, 1997
Bought by
Paxson James T and Paxson Shanon
Create a Home Valuation Report for This Property
The Home Valuation Report is an in-depth analysis detailing your home's value as well as a comparison with similar homes in the area
Home Values in the Area
Average Home Value in this Area
Purchase History
| Date | Buyer | Sale Price | Title Company |
|---|---|---|---|
| Hillestad John D | $63,000 | None Available | |
| Batt Alan | $125,500 | Photo Abstract Co | |
| Paxson James T | $79,000 | -- |
Source: Public Records
Mortgage History
| Date | Status | Borrower | Loan Amount |
|---|---|---|---|
| Closed | Hillestad John D | $80,000 | |
| Previous Owner | Batt Alan | $85,000 |
Source: Public Records
Tax History Compared to Growth
Tax History
| Year | Tax Paid | Tax Assessment Tax Assessment Total Assessment is a certain percentage of the fair market value that is determined by local assessors to be the total taxable value of land and additions on the property. | Land | Improvement |
|---|---|---|---|---|
| 2025 | $1,316 | $15,094 | $342 | $14,752 |
| 2024 | $1,316 | $14,654 | $342 | $14,312 |
| 2023 | $1,316 | $14,227 | $342 | $13,885 |
| 2022 | $1,184 | $13,813 | $342 | $13,471 |
| 2021 | $1,173 | $13,411 | $342 | $13,069 |
| 2020 | $1,145 | $13,020 | $342 | $12,678 |
| 2019 | $956 | $12,641 | $342 | $12,299 |
| 2018 | $932 | $12,273 | $342 | $11,931 |
| 2017 | $917 | $11,916 | $342 | $11,574 |
| 2016 | $849 | $11,568 | $342 | $11,226 |
| 2015 | $776 | $8,736 | $610 | $8,126 |
| 2014 | $838 | $11,232 | $342 | $10,890 |
Source: Public Records
Map
Nearby Homes