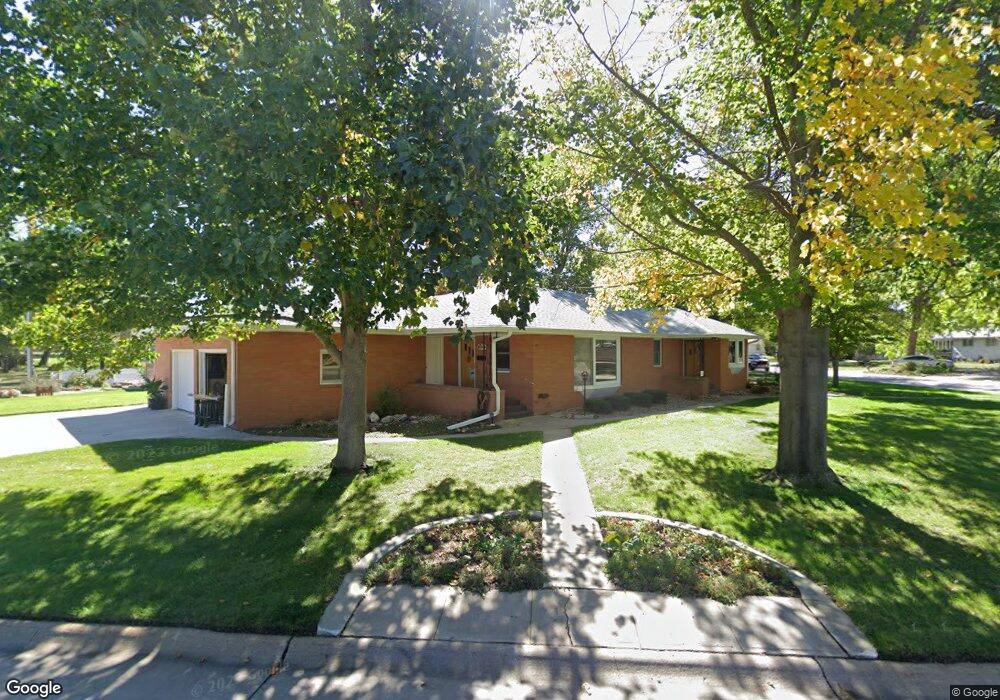
102 E Thurber St Clay Center, NE 68933
Estimated Value: $213,995 - $266,000
4
Beds
3
Baths
1,768
Sq Ft
$138/Sq Ft
Est. Value
About This Home
This home is located at 102 E Thurber St, Clay Center, NE 68933 and is currently estimated at $244,749, approximately $138 per square foot. 102 E Thurber St is a home with nearby schools including Clay Center Elementary School.
Ownership History
Date
Name
Owned For
Owner Type
Purchase Details
Closed on
Dec 13, 2017
Sold by
Clay Center Christian Church Inc
Bought by
Green Cheryl
Current Estimated Value
Create a Home Valuation Report for This Property
The Home Valuation Report is an in-depth analysis detailing your home's value as well as a comparison with similar homes in the area
Home Values in the Area
Average Home Value in this Area
Purchase History
| Date | Buyer | Sale Price | Title Company |
|---|---|---|---|
| Green Cheryl | $122,000 | None Available |
Source: Public Records
Tax History Compared to Growth
Tax History
| Year | Tax Paid | Tax Assessment Tax Assessment Total Assessment is a certain percentage of the fair market value that is determined by local assessors to be the total taxable value of land and additions on the property. | Land | Improvement |
|---|---|---|---|---|
| 2024 | $2,712 | $212,925 | $10,550 | $202,375 |
| 2023 | $3,147 | $195,780 | $9,380 | $186,400 |
| 2022 | $2,728 | $147,000 | $3,615 | $143,385 |
| 2021 | $2,635 | $138,885 | $3,615 | $135,270 |
| 2020 | $2,568 | $133,930 | $3,615 | $130,315 |
| 2019 | $2,231 | $124,275 | $3,615 | $120,660 |
| 2018 | $2,231 | $124,275 | $3,615 | $120,660 |
| 2017 | $2,049 | $121,060 | $3,615 | $117,445 |
| 2016 | $2,216 | $121,060 | $3,615 | $117,445 |
| 2015 | $24 | $121,060 | $3,615 | $117,445 |
| 2014 | -- | $121,060 | $3,615 | $117,445 |
| 2013 | -- | $100,860 | $3,450 | $97,410 |
Source: Public Records
Map
Nearby Homes
- 510 N Clay Ave
- 120 Northridge Dr
- 108 W Glenvil St
- 510 W Willow St
- 416 W South St
- 0 Pheasant View Lots
- 31020 Road L County Rd
- 208 N Kearney Ave
- 405 E Maple Ave
- 401 N Adams Ave
- 408 N Harvard Ave
- 1580
- 1580 Road 320
- 401 Chestnut St
- 608 1st St
- 811 Grandview St
- 803 6th St
- 506 W Cedar St
- 507 S Maltby Ave
- 502 S Maltby Ave
- 520 N Brown Ave
- 604 N Brown Ave
- 521 N Brown Ave
- 502 N Brown Ave
- 513 N Brown Ave
- 601 N Clay Ave
- 521 N Clay Ave
- 603 N Brown Ave
- 507 N Brown Ave
- 611 N Clay Ave
- 116 E George St
- 606 N Brown Ave
- 503 N Brown Ave
- 605 N Brown Ave
- 514 N Alexander Ave
- 118 W George St
- 600 N Alexander Ave
- 522 N Alexander Ave
- 518 N Clay Ave
- 421 N Brown Ave