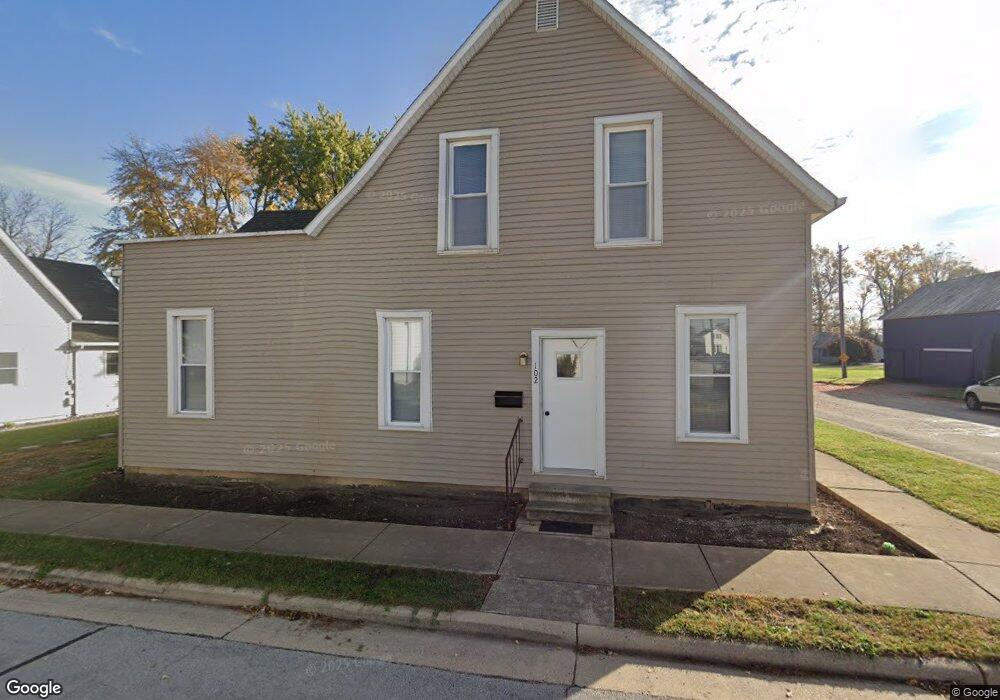
102 East St New Knoxville, OH 45871
Estimated Value: $95,000 - $178,509
3
Beds
2
Baths
2,185
Sq Ft
$60/Sq Ft
Est. Value
About This Home
This home is located at 102 East St, New Knoxville, OH 45871 and is currently estimated at $131,627, approximately $60 per square foot. 102 East St is a home located in Auglaize County with nearby schools including New Knoxville Elementary School.
Ownership History
Date
Name
Owned For
Owner Type
Purchase Details
Closed on
Mar 15, 2024
Sold by
Frank George M
Bought by
Zizelman Jacob M and Zizelman Amber N
Current Estimated Value
Home Financials for this Owner
Home Financials are based on the most recent Mortgage that was taken out on this home.
Original Mortgage
$80,000
Outstanding Balance
$77,017
Interest Rate
6.77%
Mortgage Type
Construction
Estimated Equity
$54,610
Purchase Details
Closed on
May 14, 2020
Sold by
Frank Hulda Arilyn and Frank Hulda Marilyn
Bought by
Frank Hulda Marilyn
Purchase Details
Closed on
Mar 19, 2009
Sold by
Frank Hulda Marilyn
Bought by
Frank Hulda Marilyn and Hulda Marilyn Frank Revocable Living Tru
Purchase Details
Closed on
Jul 30, 2008
Sold by
Arnett Thelma and Arnett David W
Bought by
Frank Hulda Marilyn
Create a Home Valuation Report for This Property
The Home Valuation Report is an in-depth analysis detailing your home's value as well as a comparison with similar homes in the area
Home Values in the Area
Average Home Value in this Area
Purchase History
| Date | Buyer | Sale Price | Title Company |
|---|---|---|---|
| Zizelman Jacob M | $100,000 | None Listed On Document | |
| Frank Hulda Marilyn | -- | None Available | |
| Frank Hulda Marilyn | -- | Attorney | |
| Frank Hulda Marilyn | $49,900 | Attorney |
Source: Public Records
Mortgage History
| Date | Status | Borrower | Loan Amount |
|---|---|---|---|
| Open | Zizelman Jacob M | $80,000 |
Source: Public Records
Tax History Compared to Growth
Tax History
| Year | Tax Paid | Tax Assessment Tax Assessment Total Assessment is a certain percentage of the fair market value that is determined by local assessors to be the total taxable value of land and additions on the property. | Land | Improvement |
|---|---|---|---|---|
| 2024 | $2,704 | $40,300 | $7,760 | $32,540 |
| 2023 | $1,213 | $40,300 | $7,760 | $32,540 |
| 2022 | $1,301 | $33,600 | $7,040 | $26,560 |
| 2021 | $1,282 | $33,600 | $7,040 | $26,560 |
| 2020 | $652 | $33,600 | $7,042 | $26,558 |
| 2019 | $1,188 | $28,638 | $5,968 | $22,670 |
| 2018 | $1,189 | $28,638 | $5,968 | $22,670 |
| 2017 | $1,191 | $28,638 | $5,968 | $22,670 |
| 2016 | $1,187 | $28,970 | $5,723 | $23,247 |
| 2015 | $590 | $28,970 | $5,723 | $23,247 |
| 2014 | $1,161 | $28,970 | $5,723 | $23,247 |
| 2013 | $680 | $28,970 | $5,723 | $23,247 |
Source: Public Records
Map
Nearby Homes
- 107 S Mill St
- 101 Saxony Dr
- 103 Saxony Dr
- 0 Saxony Unit 1032555
- 8937 Wiefenbach Rd
- 16785 Roettger Rd
- 116 Meadowbrook Ln
- 0 S Beech St
- 0 Schwieterman Unit 4 290334
- 0 Schwieterman Unit 8 290342
- 0 Schwieterman Unit 10 290345
- 0 Schwieterman Unit 11 290346
- 0 Schwieterman Unit 1 290329
- 0 Schwieterman Unit 9 290344
- 0 Schwieterman Unit 7 290341
- 0 Schwieterman Unit 12 290347
- 0 Schwieterman Unit 13 290348
- 437 Woodward St
- 408 S Vine St
- 200 N Knoxville Ave Unit 7