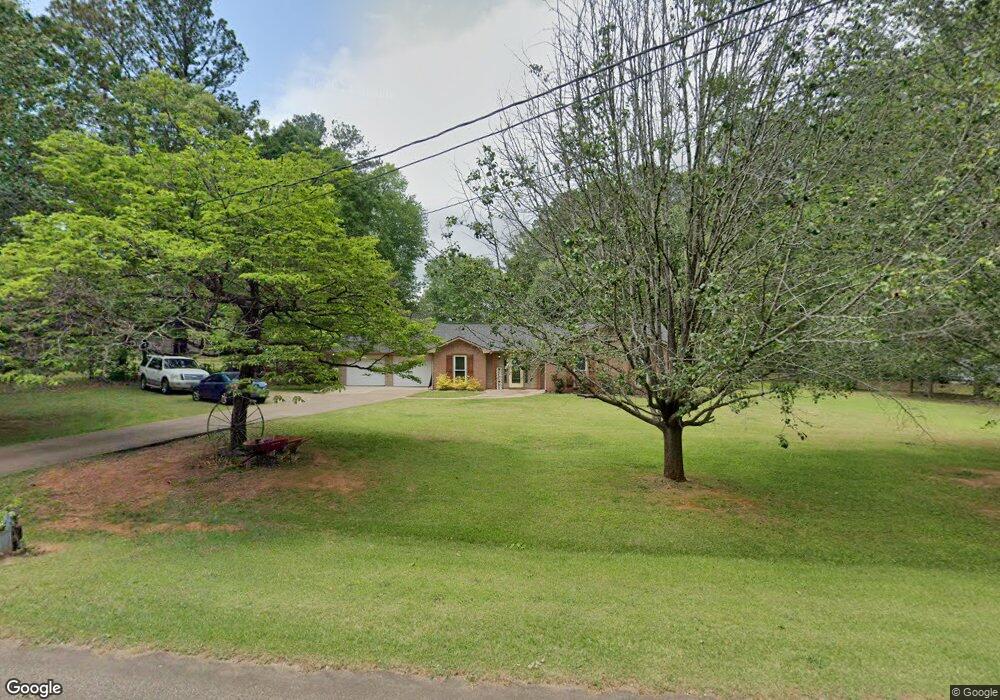
102 Evans Ct Lagrange, GA 30241
Estimated Value: $234,000 - $250,000
3
Beds
2
Baths
1,478
Sq Ft
$163/Sq Ft
Est. Value
About This Home
This home is located at 102 Evans Ct, Lagrange, GA 30241 and is currently estimated at $241,334, approximately $163 per square foot. 102 Evans Ct is a home located in Troup County with nearby schools including Callaway Elementary School, Hogansville Elementary School, and Callaway Middle School.
Ownership History
Date
Name
Owned For
Owner Type
Purchase Details
Closed on
Nov 4, 2005
Sold by
Wilson James M
Bought by
Garrett Michael B
Current Estimated Value
Home Financials for this Owner
Home Financials are based on the most recent Mortgage that was taken out on this home.
Original Mortgage
$132,000
Outstanding Balance
$78,029
Interest Rate
7.67%
Mortgage Type
New Conventional
Estimated Equity
$163,305
Purchase Details
Closed on
Aug 31, 2001
Sold by
Jennie Edgar T and Jennie Pierce
Bought by
Wilson James M and Wilson Donnita A
Purchase Details
Closed on
Sep 30, 1998
Sold by
Robert Brewell Parker
Bought by
Jennie Edgar T and Jennie Pierce
Purchase Details
Closed on
May 22, 1996
Sold by
Roger Chuck Freeman
Bought by
Robert Brewell Parker
Purchase Details
Closed on
Oct 1, 1988
Sold by
J B Mize Contractor Inc
Bought by
Roger Chuck Freeman
Purchase Details
Closed on
Mar 1, 1988
Sold by
Daniel-Evans Dev Corp
Bought by
J B Mize Contractor Inc
Purchase Details
Closed on
Oct 1, 1975
Bought by
Daniel-Evans Dev Corp
Create a Home Valuation Report for This Property
The Home Valuation Report is an in-depth analysis detailing your home's value as well as a comparison with similar homes in the area
Purchase History
| Date | Buyer | Sale Price | Title Company |
|---|---|---|---|
| Garrett Michael B | $132,000 | -- | |
| Wilson James M | $109,400 | -- | |
| Jennie Edgar T | $94,500 | -- | |
| Robert Brewell Parker | $76,000 | -- | |
| Roger Chuck Freeman | $68,000 | -- | |
| J B Mize Contractor Inc | -- | -- | |
| Daniel-Evans Dev Corp | -- | -- |
Source: Public Records
Mortgage History
| Date | Status | Borrower | Loan Amount |
|---|---|---|---|
| Open | Garrett Michael B | $132,000 |
Source: Public Records
Tax History
| Year | Tax Paid | Tax Assessment Tax Assessment Total Assessment is a certain percentage of the fair market value that is determined by local assessors to be the total taxable value of land and additions on the property. | Land | Improvement |
|---|---|---|---|---|
| 2025 | $1,969 | $75,384 | $10,000 | $65,384 |
| 2024 | $1,964 | $72,024 | $10,000 | $62,024 |
| 2023 | $2,007 | $73,592 | $10,000 | $63,592 |
| 2022 | $1,971 | $70,632 | $10,000 | $60,632 |
| 2021 | $1,613 | $53,492 | $8,000 | $45,492 |
| 2020 | $1,613 | $53,492 | $8,000 | $45,492 |
| 2019 | $1,470 | $48,732 | $4,800 | $43,932 |
| 2018 | $1,334 | $44,224 | $5,000 | $39,224 |
| 2017 | $1,334 | $44,224 | $5,000 | $39,224 |
| 2016 | $1,316 | $43,629 | $5,000 | $38,629 |
| 2015 | $1,318 | $43,629 | $5,000 | $38,629 |
| 2014 | $1,259 | $41,596 | $5,000 | $36,596 |
| 2013 | -- | $40,298 | $5,000 | $35,298 |
Source: Public Records
Map
Nearby Homes
- 119 Sir Lancelot St
- 200 River Meadow Dr
- 234 River Meadow Dr
- 200 Freshwater Ct Unit 37
- 202 Freshwater Ct Unit E36
- 202 Freshwater Ct
- 204 Freshwater Ct
- 10 Whitfield Rd
- 402 Sweetwood Ct Unit LOT 2
- 302 Glenhaven Dr Unit 2D
- 300 Glenhaven Dr Unit 1D
- 206 Freshwater Ct Unit 34E
- 206 Freshwater Ct
- 503 Headwater Ct Unit 4D
- 106 Shenandoah Ln Unit 26E
- 106 Shenandoah Ln
- 114 Shenandoah Ln
- 108 Shenandoah Ln
- 108 Shenandoah Ln Unit 27E
- 502 Headwater Ct Unit 8D
- 104 Evans Ct
- 100 Evans Ct
- 80 Beaver Run
- 82 Beaver Run
- 105 Evans Ct
- 106 Evans Ct
- 81 Beaver Run
- 193 Moccasin Trail
- 84 Beaver Run
- 108 Evans Ct
- 83 Beaver Run
- 107 Evans Ct
- 195 Moccasin Trail
- 192 Moccasin Trail
- 190 Moccasin Trail
- 194 Moccasin Trail
- 86 Beaver Run
- 80 Clearwater Dr
- 85 Beaver Run
- 110 Evans Ct
Your Personal Tour Guide
Ask me questions while you tour the home.