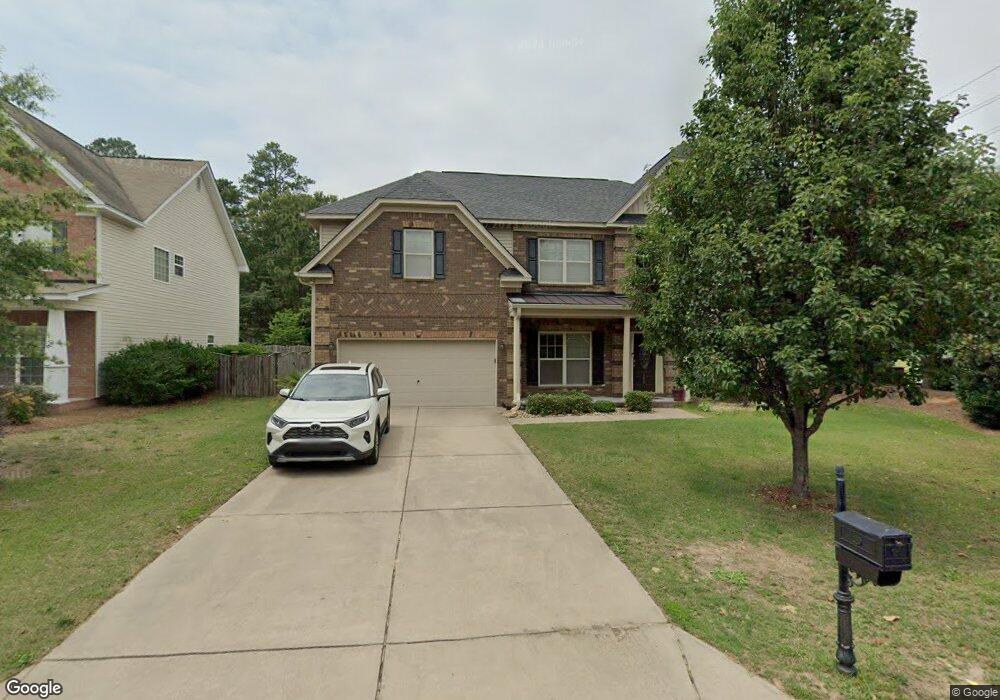
102 Flagstone Way Lexington, SC 29072
Estimated Value: $415,000 - $460,000
5
Beds
3
Baths
3,501
Sq Ft
$127/Sq Ft
Est. Value
About This Home
This home is located at 102 Flagstone Way, Lexington, SC 29072 and is currently estimated at $445,720, approximately $127 per square foot. 102 Flagstone Way is a home located in Lexington County with nearby schools including Lake Murray Elementary School, Beechwood Middle School, and Lexington High School.
Ownership History
Date
Name
Owned For
Owner Type
Purchase Details
Closed on
Oct 18, 2021
Sold by
Dobbins Treacy L and Dobbins Veronica
Bought by
Siddela Shyam Roshan and Thati Bhavani
Current Estimated Value
Home Financials for this Owner
Home Financials are based on the most recent Mortgage that was taken out on this home.
Original Mortgage
$288,000
Outstanding Balance
$262,629
Interest Rate
2.8%
Mortgage Type
Purchase Money Mortgage
Estimated Equity
$183,091
Purchase Details
Closed on
Jan 9, 2015
Sold by
Carver Michael Todd and Carver Jacqueline Yvette
Bought by
Dobbins Treacy L and Dobbins Veronica
Purchase Details
Closed on
Mar 21, 2013
Sold by
Essex Homes Southeast Inc
Bought by
Carver Michael Todd and Carver Jacqueline Yvette
Home Financials for this Owner
Home Financials are based on the most recent Mortgage that was taken out on this home.
Original Mortgage
$181,600
Interest Rate
3.56%
Mortgage Type
Future Advance Clause Open End Mortgage
Create a Home Valuation Report for This Property
The Home Valuation Report is an in-depth analysis detailing your home's value as well as a comparison with similar homes in the area
Home Values in the Area
Average Home Value in this Area
Purchase History
| Date | Buyer | Sale Price | Title Company |
|---|---|---|---|
| Siddela Shyam Roshan | $377,000 | None Available | |
| Dobbins Treacy L | $233,500 | -- | |
| Carver Michael Todd | $227,000 | -- |
Source: Public Records
Mortgage History
| Date | Status | Borrower | Loan Amount |
|---|---|---|---|
| Open | Siddela Shyam Roshan | $288,000 | |
| Previous Owner | Carver Michael Todd | $181,600 |
Source: Public Records
Tax History Compared to Growth
Tax History
| Year | Tax Paid | Tax Assessment Tax Assessment Total Assessment is a certain percentage of the fair market value that is determined by local assessors to be the total taxable value of land and additions on the property. | Land | Improvement |
|---|---|---|---|---|
| 2024 | $2,252 | $15,080 | $1,600 | $13,480 |
| 2023 | $2,252 | $15,080 | $1,600 | $13,480 |
| 2022 | $2,245 | $15,080 | $1,600 | $13,480 |
| 2020 | $1,452 | $10,741 | $1,380 | $9,361 |
| 2019 | $1,452 | $9,340 | $1,280 | $8,060 |
| 2018 | $1,425 | $9,340 | $1,280 | $8,060 |
| 2017 | $1,382 | $9,340 | $1,280 | $8,060 |
| 2016 | $1,370 | $9,340 | $1,280 | $8,060 |
| 2014 | $1,274 | $9,079 | $1,600 | $7,479 |
| 2013 | -- | $13,620 | $2,400 | $11,220 |
Source: Public Records
Map
Nearby Homes
- 505 Wise Ferry Rd
- 313 Misty Spring Ct
- 208 Wild Springs Ct
- 412 Saint Claire Place
- 413 Jordan Way
- 208 Beauclaire Dr
- 540 Hwy 378
- 100 Ridge Top Rd
- 134 Stoney Creek Ln
- 329 Grey Oaks Ct
- 190 Grey Oaks Ln
- 313 Oneil Ln
- 529 Meadow Grass Ln
- 606 Meadow Grass Ln
- Oxford Plan at Hadleigh Park
- Burke Plan at Hadleigh Park
- Ellerbe Plan at Hadleigh Park
- Arlington Plan at Hadleigh Park
- 108 Dupre Mill Rd
- 108 Red Barn Rd
- 167 Flagstone Way
- 110 Flagstone Way
- 103 Flagstone Way
- 114 Flagstone Way
- 111 Flagstone Way
- 465 Wise Ferry Rd
- 460 Wise Ferry Rd
- 118 Flagstone Way
- 452 Wise Ferry Rd
- 115 Flagstone Way
- 119 Flagstone Way
- 124 Flagstone Way
- 123 Flagstone Way
- 128 Flagstone Way
- 439 Wise Ferry Rd
- 127 Flagstone Way
- 132 Flagstone Way
- 473 Wise Ferry Rd
- 131 Flagstone Way
- 1483 Old Cherokee Rd