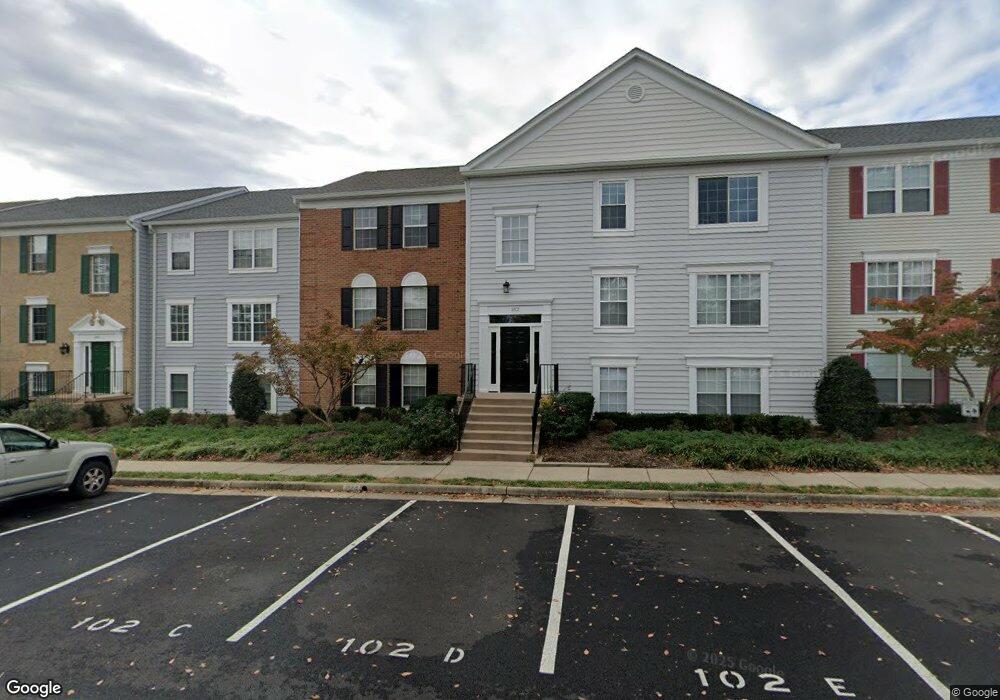
102 Fort Evans Rd SE Unit E Leesburg, VA 20175
Estimated Value: $267,000 - $294,000
2
Beds
1
Bath
851
Sq Ft
$324/Sq Ft
Est. Value
About This Home
This home is located at 102 Fort Evans Rd SE Unit E, Leesburg, VA 20175 and is currently estimated at $275,583, approximately $323 per square foot. 102 Fort Evans Rd SE Unit E is a home located in Loudoun County with nearby schools including Frederick Douglass Elementary School, J. Lupton Simpson Middle School, and Loudoun County High School.
Ownership History
Date
Name
Owned For
Owner Type
Purchase Details
Closed on
Dec 24, 2024
Sold by
Orellana Jose Mario and Orellana Maria Margoth
Bought by
Orellana Jose Mario and Fam Maria
Current Estimated Value
Purchase Details
Closed on
Oct 19, 2010
Sold by
Stunkle C Ryland
Bought by
Laird David
Home Financials for this Owner
Home Financials are based on the most recent Mortgage that was taken out on this home.
Original Mortgage
$100,000
Interest Rate
4.37%
Mortgage Type
New Conventional
Purchase Details
Closed on
Mar 27, 2006
Sold by
Reaves Dennis
Bought by
Stunkle C Ryland
Purchase Details
Closed on
Mar 25, 2005
Sold by
Miller Marc
Bought by
Reaves Dennis
Home Financials for this Owner
Home Financials are based on the most recent Mortgage that was taken out on this home.
Original Mortgage
$171,920
Interest Rate
5.56%
Mortgage Type
Construction
Create a Home Valuation Report for This Property
The Home Valuation Report is an in-depth analysis detailing your home's value as well as a comparison with similar homes in the area
Home Values in the Area
Average Home Value in this Area
Purchase History
| Date | Buyer | Sale Price | Title Company |
|---|---|---|---|
| Orellana Jose Mario | -- | None Listed On Document | |
| Laird David | $125,000 | -- | |
| Stunkle C Ryland | $247,500 | -- | |
| Reaves Dennis | $214,900 | -- |
Source: Public Records
Mortgage History
| Date | Status | Borrower | Loan Amount |
|---|---|---|---|
| Previous Owner | Laird David | $100,000 | |
| Previous Owner | Reaves Dennis | $171,920 |
Source: Public Records
Tax History Compared to Growth
Tax History
| Year | Tax Paid | Tax Assessment Tax Assessment Total Assessment is a certain percentage of the fair market value that is determined by local assessors to be the total taxable value of land and additions on the property. | Land | Improvement |
|---|---|---|---|---|
| 2025 | $2,055 | $255,330 | $100,000 | $155,330 |
| 2024 | $2,196 | $253,840 | $90,000 | $163,840 |
| 2023 | $2,094 | $239,370 | $90,000 | $149,370 |
| 2022 | $1,931 | $216,930 | $65,000 | $151,930 |
| 2021 | $1,946 | $198,520 | $50,000 | $148,520 |
| 2020 | $1,896 | $183,200 | $50,000 | $133,200 |
| 2019 | $1,813 | $173,460 | $40,000 | $133,460 |
| 2018 | $1,766 | $162,740 | $40,000 | $122,740 |
| 2017 | $1,770 | $157,370 | $40,000 | $117,370 |
| 2016 | $1,833 | $160,060 | $0 | $0 |
| 2015 | $133 | $104,870 | $0 | $104,870 |
| 2014 | $252 | $97,720 | $0 | $97,720 |
Source: Public Records
Map
Nearby Homes
- 101 Fort Evans Rd SE Unit F
- 118 Fort Evans Rd SE Unit C
- 589 Rockbridge Dr SE
- 135 Oak View Dr SE
- 251 Meadows Ln NE
- 214 Shenandoah St SE
- 678 Gateway Dr SE Unit 907
- BIRKHALL Plan at Brickyard
- HIGHGROVE Plan at Brickyard
- BALMORAL Plan at Brickyard
- 664 Gateway Dr SE Unit 314
- 134 Shirley Square SE
- 265 High Rail Terrace SE
- 421 Bicksler Square SE
- 411 Bicksler Square SE
- 316 Baish Dr SE
- 459 Kornblau Terrace SE
- 608 Blue Ridge Ave NE
- 202 Murdoch Square SE
- 219 Chianti Terrace SE
- 102 Fort Evans Rd SE Unit A
- 102 Fort Evans Rd SE Unit C
- 102 Fort Evans Rd SE Unit F
- 102 Fort Evans Rd SE Unit D
- 102 Fort Evans Rd SE Unit B
- 102 Fort Evans Rd SE Unit 7
- 102 Fort Evans Rd SE Unit 7
- 101 Fort Evans Rd SE Unit B
- 101 Fort Evans Rd SE Unit C
- 101 Fort Evans Rd SE Unit A
- 101 Fort Evans Rd SE Unit E
- 101 Fort Evans Rd SE Unit D
- 101 Fort Evans Rd SE Unit 6
- 101D Fort Evans Rd SE Unit 2
- 103 Fort Evans Rd SE Unit A
- 103 Fort Evans Rd SE Unit E
- 103 Fort Evans Rd SE Unit B
- 103 Fort Evans Rd SE Unit C
- 103 Fort Evans Rd SE Unit F
- 103 Fort Evans Rd SE Unit D