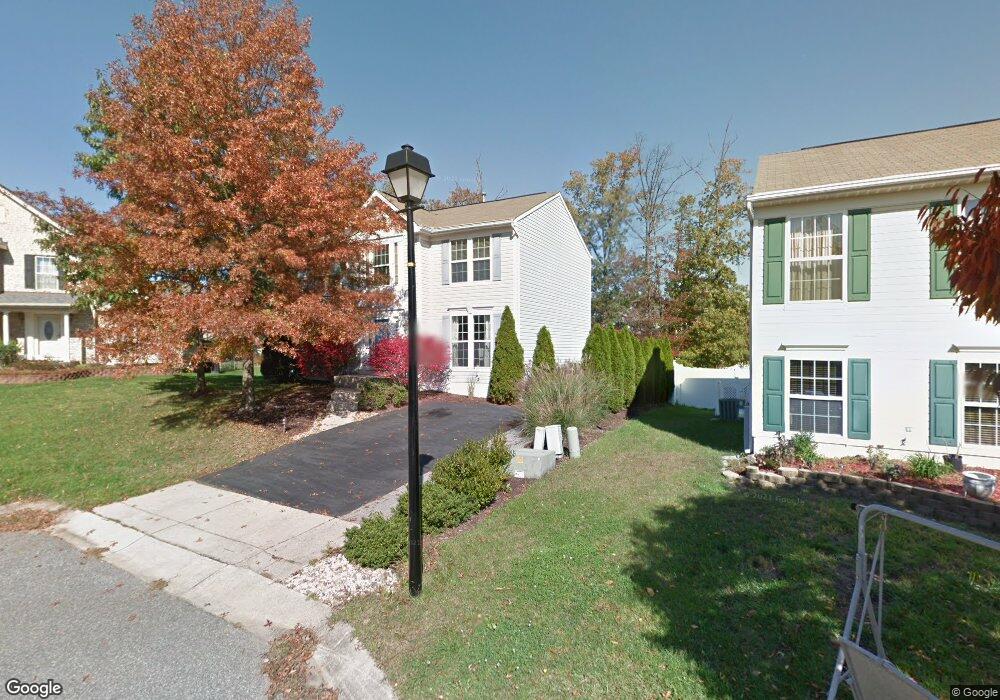
102 Foxhorn Way Glen Burnie, MD 21061
Estimated Value: $526,722 - $581,000
4
Beds
4
Baths
1,920
Sq Ft
$285/Sq Ft
Est. Value
About This Home
This home is located at 102 Foxhorn Way, Glen Burnie, MD 21061 and is currently estimated at $546,681, approximately $284 per square foot. 102 Foxhorn Way is a home located in Anne Arundel County with nearby schools including Southgate Elementary School, Old Mill Middle School North, and Old Mill High School.
Ownership History
Date
Name
Owned For
Owner Type
Purchase Details
Closed on
Mar 6, 2009
Sold by
Kroll Michael J
Bought by
Bereznak Justin M and Bereznak Deborah U
Current Estimated Value
Home Financials for this Owner
Home Financials are based on the most recent Mortgage that was taken out on this home.
Original Mortgage
$275,000
Outstanding Balance
$174,955
Interest Rate
5.14%
Mortgage Type
Purchase Money Mortgage
Estimated Equity
$371,726
Purchase Details
Closed on
Dec 9, 2003
Sold by
Bosworth Newton E
Bought by
Kroll Michael J and Kroll Sherry L
Purchase Details
Closed on
Aug 24, 2001
Sold by
Hoffman Donald L
Bought by
Bosworth Newton E and Sanders Stacie L
Purchase Details
Closed on
Sep 24, 1996
Sold by
Nvr Homes Inc
Bought by
Hoffman Donald L and Balke Martina
Purchase Details
Closed on
Jul 16, 1996
Sold by
Attman Construction Co Inc
Bought by
Nvr Homes Inc
Create a Home Valuation Report for This Property
The Home Valuation Report is an in-depth analysis detailing your home's value as well as a comparison with similar homes in the area
Home Values in the Area
Average Home Value in this Area
Purchase History
| Date | Buyer | Sale Price | Title Company |
|---|---|---|---|
| Bereznak Justin M | $360,000 | -- | |
| Kroll Michael J | $305,000 | -- | |
| Bosworth Newton E | $205,000 | -- | |
| Hoffman Donald L | $173,275 | -- | |
| Nvr Homes Inc | $55,000 | -- |
Source: Public Records
Mortgage History
| Date | Status | Borrower | Loan Amount |
|---|---|---|---|
| Open | Bereznak Justin M | $275,000 | |
| Closed | Hoffman Donald L | -- |
Source: Public Records
Tax History Compared to Growth
Tax History
| Year | Tax Paid | Tax Assessment Tax Assessment Total Assessment is a certain percentage of the fair market value that is determined by local assessors to be the total taxable value of land and additions on the property. | Land | Improvement |
|---|---|---|---|---|
| 2025 | $4,530 | $420,800 | -- | -- |
| 2024 | $4,530 | $386,700 | $174,300 | $212,400 |
| 2023 | $4,413 | $379,967 | $0 | $0 |
| 2022 | $4,128 | $373,233 | $0 | $0 |
| 2021 | $8,112 | $366,500 | $164,100 | $202,400 |
| 2020 | $3,944 | $358,033 | $0 | $0 |
| 2019 | $3,876 | $349,567 | $0 | $0 |
| 2018 | $3,459 | $341,100 | $142,100 | $199,000 |
| 2017 | $3,639 | $329,400 | $0 | $0 |
| 2016 | -- | $317,700 | $0 | $0 |
| 2015 | -- | $306,000 | $0 | $0 |
| 2014 | -- | $306,000 | $0 | $0 |
Source: Public Records
Map
Nearby Homes
- 219 Mall Rd
- 90 Foxchase Ct
- 8331 Elvaton Rd
- 220 Foxtree Dr
- 221 Foxmanor Ln
- 8345 Elvaton Rd
- 8304 Patience Ln
- 8318 Elvaton Rd
- 219 Cabernet St
- 7911 Ritchie Hwy
- 8381 Amber Beacon Cir
- 268 Glenda Ct
- 100 Sandsbury Ave
- 248 Michele Cir
- 1109 Castle Harbour Way Unit 2D
- 221 Gunther Place
- 258 Nathan Way
- 266 Nathan Way
- 206 Sandsbury Ave
- 7956 Oakwood Rd
- 104 Foxhorn Way
- 100 Foxhorn Way
- 53 Foxwell Bend Rd
- 8004 Foxglen Ct
- 8003 Foxglen Ct
- 55 Foxwell Bend Rd
- 105 Foxhorn Way
- 103 Foxhorn Way
- 8011 Trumpeter Ct
- 8013 Trumpeter Ct
- 101 Foxhorn Way
- 8002 Foxglen Ct
- 117 Mall Rd
- 8009 Trumpeter Ct
- 119 Mall Rd
- 8012 Trumpeter Ct
- 47 Foxwell Bend Rd
- 101 Foxtrap Dr
- 107 Foxtrap Dr
- 115 Mall Rd