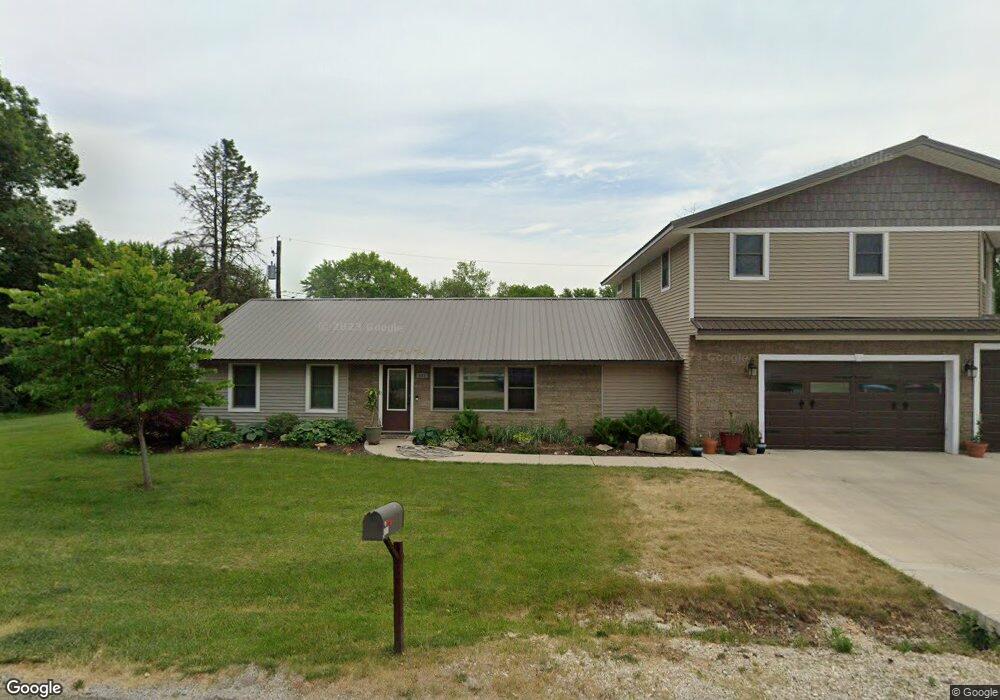
102 Fraser St East Peoria, IL 61611
Estimated Value: $228,000 - $257,313
--
Bed
--
Bath
2,382
Sq Ft
$102/Sq Ft
Est. Value
About This Home
This home is located at 102 Fraser St, East Peoria, IL 61611 and is currently estimated at $243,578, approximately $102 per square foot. 102 Fraser St is a home located in Tazewell County with nearby schools including P.L. Bolin Elementary School, Neil A. Armstrong School, and Central Junior High School.
Ownership History
Date
Name
Owned For
Owner Type
Purchase Details
Closed on
Oct 7, 2021
Sold by
Swearingian Angela R
Bought by
Swearingian Robert W
Current Estimated Value
Home Financials for this Owner
Home Financials are based on the most recent Mortgage that was taken out on this home.
Original Mortgage
$231,200
Outstanding Balance
$210,833
Interest Rate
2.8%
Mortgage Type
New Conventional
Estimated Equity
$32,745
Purchase Details
Closed on
Jan 7, 2011
Sold by
Swearingian Robert Wesley and Swearingian Debra L
Bought by
Swearingian Ii Robert W and Swearingian Angela R
Home Financials for this Owner
Home Financials are based on the most recent Mortgage that was taken out on this home.
Original Mortgage
$75,000
Interest Rate
4.5%
Mortgage Type
New Conventional
Create a Home Valuation Report for This Property
The Home Valuation Report is an in-depth analysis detailing your home's value as well as a comparison with similar homes in the area
Home Values in the Area
Average Home Value in this Area
Purchase History
| Date | Buyer | Sale Price | Title Company |
|---|---|---|---|
| Swearingian Robert W | -- | Hometown Title | |
| Swearingian Ii Robert W | $95,000 | Pekin Title Llc |
Source: Public Records
Mortgage History
| Date | Status | Borrower | Loan Amount |
|---|---|---|---|
| Open | Swearingian Robert W | $231,200 | |
| Previous Owner | Swearingian Ii Robert W | $75,000 |
Source: Public Records
Tax History Compared to Growth
Tax History
| Year | Tax Paid | Tax Assessment Tax Assessment Total Assessment is a certain percentage of the fair market value that is determined by local assessors to be the total taxable value of land and additions on the property. | Land | Improvement |
|---|---|---|---|---|
| 2024 | $5,384 | $67,850 | $10,890 | $56,960 |
| 2023 | $5,384 | $62,450 | $10,020 | $52,430 |
| 2022 | $5,106 | $58,030 | $9,310 | $48,720 |
| 2021 | $4,879 | $55,800 | $8,950 | $46,850 |
| 2020 | $4,616 | $54,180 | $8,690 | $45,490 |
| 2019 | $2,207 | $54,180 | $8,690 | $45,490 |
| 2018 | $2,147 | $54,180 | $8,690 | $45,490 |
| 2017 | $2,127 | $53,640 | $8,600 | $45,040 |
| 2016 | $2,052 | $53,640 | $8,600 | $45,040 |
| 2015 | $1,799 | $0 | $0 | $0 |
| 2013 | $1,812 | $28,490 | $8,600 | $19,890 |
Source: Public Records
Map
Nearby Homes
- 508 Highview Rd
- 202 Castle Ln
- 117 Greenlawn Ct
- 108 Walnut Ct
- 304 Indian Cir
- 208 Montrose Ave
- 114 Raynor St
- 0000 Highway 24
- Lot 7 Sundance Ln
- 132 Star Rim Dr
- 129 Cherbourg Ct
- Lot 6 Oakwood Rd
- 950 N Main St
- 615 Meadow Ave
- 1608 Highview Rd
- 100 Oakridge Ct
- 3300 E Washington St
- 3304 E Washington St
- 123 Terrace Ln
- 700 N Main St