
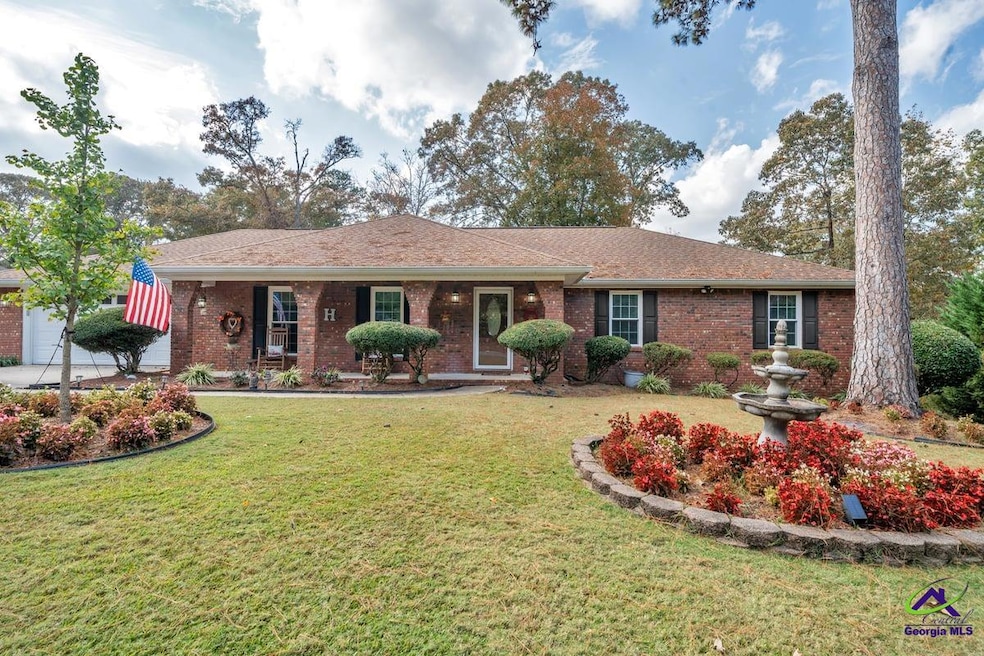
102 Gatlin Ct Warner Robins, GA 31088
Estimated payment $1,723/month
Total Views
3,885
3
Beds
2
Baths
2,104
Sq Ft
$140
Price per Sq Ft
Highlights
- Very Popular Property
- 1 Fireplace
- Porch
- Deck
- Formal Dining Room
- Home Security System
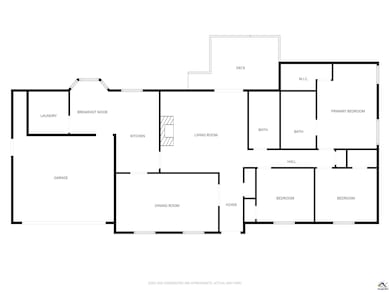
About This Home
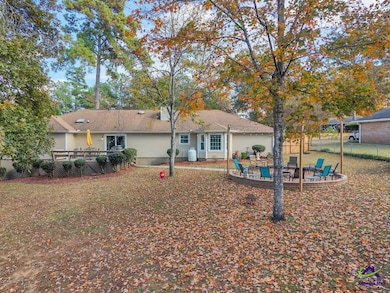
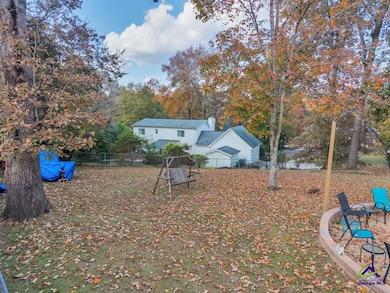
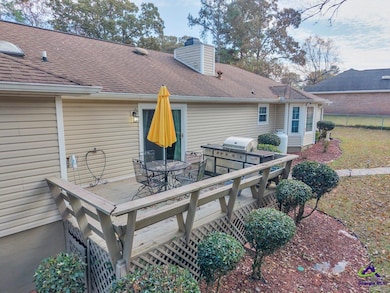
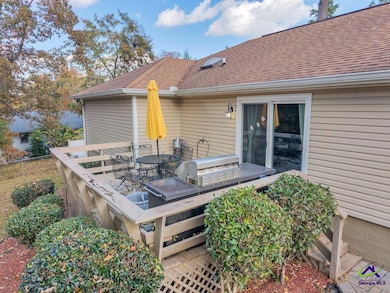
Welcome to your "Sweet Retreat," an all-brick oasis nestled on a tranquil cul-de-sac where you can escape the hustle and bustle - with the added bonus of no city tax! This stunning home is the epitome of southern charm and modern convenience. Convenient to RAFB, schools, shopping and I-75! Step out back and discover an entertainer's paradise! The amazing back deck and a huge fire pit with ambient lighting beckon you to host unforgettable gatherings under the stars. The rocking chair front porch offers a peaceful spot for morning coffee, embodying the perfect balance of relaxation and fun. Inside, discover a floor plan designed for comfortable living. The cozy den, complete with new gas logs in the charming fireplace, is the ideal spot for winter evenings. The formal living room and spacious bedrooms provide ample room for family and guests to unwind and recharge. This home is as reliable as it is beautiful, featuring numerous high-value updates for your peace of mind: new Septic System, new Windows, new HVAC and the assurance continues with a powerful Generac generator that automatically kicks on if the power ever goes out, ensuring you're never left in the dark! Don't miss the chance to own this meticulously maintained and thoughtfully upgraded gem. It’s more than just a house; it’s the tranquil, secure, and exciting lifestyle you've been dreaming of! Call today to schedule your private showing and start living the sweet life!
Home Details
Home Type
- Single Family
Est. Annual Taxes
- $2,015
Year Built
- Built in 1985
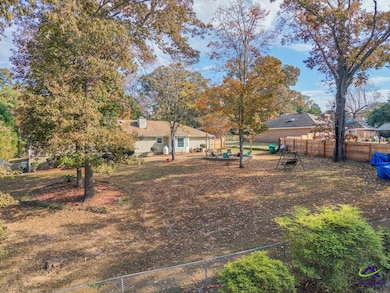
Lot Details
- 0.47 Acre Lot
- Privacy Fence
- Fenced
Home Design
- Brick Exterior Construction
- Slab Foundation
Interior Spaces
- 2,104 Sq Ft Home
- 1-Story Property
- Ceiling Fan
- 1 Fireplace
- Blinds
- Formal Dining Room
- Storage In Attic
- Home Security System
Kitchen
- Electric Range
- Dishwasher
Flooring
- Carpet
- Luxury Vinyl Plank Tile
Bedrooms and Bathrooms
- 3 Bedrooms
- 2 Full Bathrooms
- Garden Bath
Parking
- 2 Car Garage
- Garage Door Opener
Outdoor Features
- Deck
- Porch
Schools
- Russell Elementary School
- Huntington Middle School
- Warner Robins High School
Utilities
- Heat Pump System
- Septic Tank
- Cable TV Available
Listing and Financial Details
- Tax Lot 20
Map
Create a Home Valuation Report for This Property
The Home Valuation Report is an in-depth analysis detailing your home's value as well as a comparison with similar homes in the area
Home Values in the Area
Average Home Value in this Area
Tax History
| Year | Tax Paid | Tax Assessment Tax Assessment Total Assessment is a certain percentage of the fair market value that is determined by local assessors to be the total taxable value of land and additions on the property. | Land | Improvement |
|---|---|---|---|---|
| 2024 | $2,015 | $84,240 | $9,600 | $74,640 |
| 2023 | $1,670 | $69,080 | $8,000 | $61,080 |
| 2022 | $1,582 | $65,440 | $8,000 | $57,440 |
| 2021 | $1,501 | $61,800 | $8,000 | $53,800 |
| 2020 | $1,360 | $55,720 | $10,000 | $45,720 |
| 2019 | $1,360 | $55,720 | $10,000 | $45,720 |
| 2018 | $1,360 | $55,720 | $10,000 | $45,720 |
| 2017 | $1,361 | $55,720 | $10,000 | $45,720 |
| 2016 | $1,398 | $57,120 | $10,000 | $47,120 |
| 2015 | $1,401 | $57,120 | $10,000 | $47,120 |
| 2014 | -- | $57,120 | $10,000 | $47,120 |
| 2013 | -- | $57,120 | $10,000 | $47,120 |
Source: Public Records
Property History
| Date | Event | Price | List to Sale | Price per Sq Ft |
|---|---|---|---|---|
| 11/07/2025 11/07/25 | For Sale | $295,000 | -- | $140 / Sq Ft |
Source: Central Georgia MLS
Purchase History
| Date | Type | Sale Price | Title Company |
|---|---|---|---|
| Warranty Deed | $158,000 | None Available | |
| Deed | $103,900 | -- | |
| Deed | -- | -- | |
| Deed | -- | -- | |
| Deed | -- | -- | |
| Deed | -- | -- |
Source: Public Records
Mortgage History
| Date | Status | Loan Amount | Loan Type |
|---|---|---|---|
| Closed | $113,000 | New Conventional |
Source: Public Records
About the Listing Agent
Agent/Estate Liquidation Specialist (18 years experience)
Specialties: Buyer's Agent, Listing Agent, Foreclosure, Estate Liquidation Specialist
Hello
My name is Jillinda Falen and I would love to help you buy your dream house or investment property as well as to help you sell your current home. I am a multi-million producer, Estate Liquidation Specialist and have twice received Realtor of the year for my board. I was a military spouse for over 20 years, have been divorced and owned
Jillinda's Other Listings
-
$89,000
- Land
- 12.75 Acres
- $6,980 per Acre
- Parcel 6 Carl Rogers Rd
- Reynolds, GA
Beautiful unrestricted and affordable country homesites! Lots of deer and turkey. 5 acre lots for 39k up to 12+ acre lots for 89k. Buy one or more
Jillinda Falen Landmark Realty
-
$72,000
- Land
- 9.61 Acres
- $7,492 per Acre
- Parcel 13 Carl Rogers Rd
- Reynolds, GA
Beautiful unrestricted and affordable country homesites! Lots of deer and turkey. 5 acre lots for 39k up to 12+ acre lots for 89k. Buy one or more!
Jillinda Falen Landmark Realty
-
$89,000
- Land
- 12.75 Acres
- $6,980 per Acre
- Parcel 8 Carl Rogers Rd
- Reynolds, GA
Beautiful unrestricted and affordable country homesites! Lots of deer and turkey. 5 acre lots for 39k up to 12+ acre lots for 89k. Buy one or more!
Jillinda Falen Landmark Realty
-
$89,000
- Land
- 12.76 Acres
- $6,975 per Acre
- Parcel 5 Carl Rogers Rd
- Reynolds, GA
Beautiful unrestricted and affordable country homesites! Lots of deer and turkey. 5 acre lots for 39k up to 12+ acre lots for 89k. Buy one or more!
Jillinda Falen Landmark Realty
-
$89,000
- Land
- 12.75 Acres
- $6,980 per Acre
- Parcel 7 Carl Rogers Rd
- Reynolds, GA
Beautiful unrestricted and affordable country homesites! Lots of deer and turkey. 5 acre lots for 39k up to 12+ acre lots for 89k. Buy one or more!
Jillinda Falen Landmark Realty
-
$72,000
- Land
- 9.61 Acres
- $7,492 per Acre
- Parcel 12 Carl Rogers Rd
- Reynolds, GA
Beautiful unrestricted and affordable country homesites! Lots of deer and turkey. 5 acre lots for 39k up to 12+ acre lots for 89k. Buy one or more!
Jillinda Falen Landmark Realty
Source: Central Georgia MLS
MLS Number: 257162
APN: 00100I017000
Disclaimer: Certain information contained herein is derived from information provided by parties other than Homes.com. All information provided is deemed reliable, but is not guaranteed to be accurate and should be independently verified.
![]() IDX information is provided exclusively for personal, non-commercial use, and may not be used for any purpose other than to identify prospective properties consumers may be interested in purchasing. Information is deemed reliable but not guaranteed.
IDX information is provided exclusively for personal, non-commercial use, and may not be used for any purpose other than to identify prospective properties consumers may be interested in purchasing. Information is deemed reliable but not guaranteed.
Nearby Homes
- 100 Leisure Pointe Cove
- 800 Leisure Lake Dr
- 117 Island Blvd
- 210 Chadwyck Cir
- 113 Kentshire Ln
- 103 Shallowford Rd
- 501 Leisure Lake Dr
- 301 S Corder Rd
- 208 Strawbridge Ln
- 110 Peach Blossom Rd
- 105 Vinewood Ct
- 91 Bass Rd
- 104 Williamsburg Ave
- 202 Grand Ave
- 305 Grand Ave
- 519 Arrowhead Trail
- 100 Lochlyn Place
- 117 Webster Way
- 200 Chestnut Rd
- 2241 Moody Rd