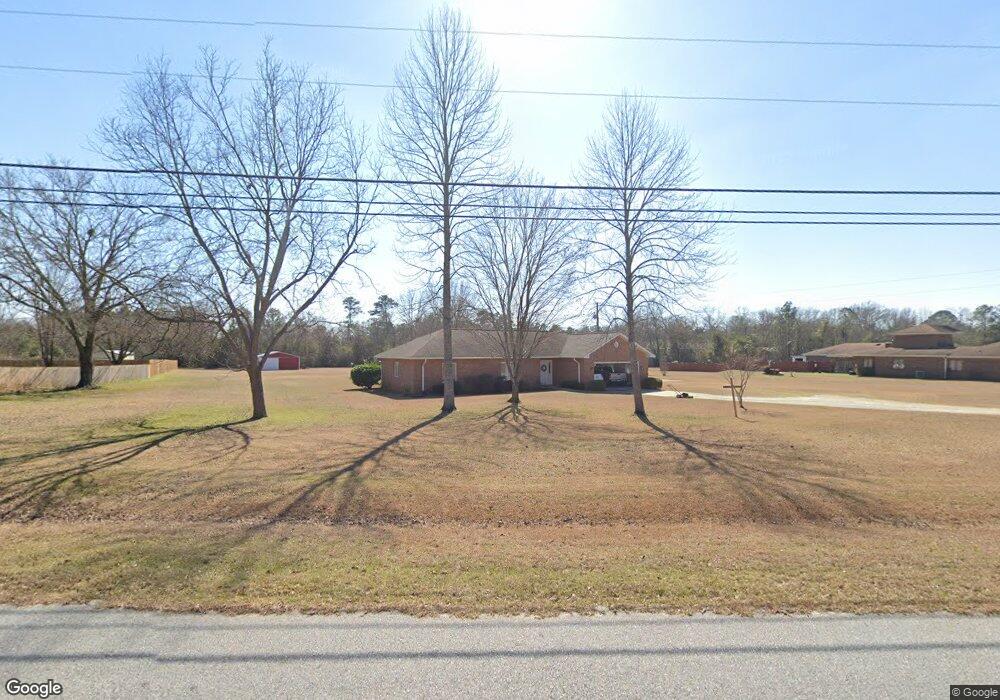
102 General Lee Rd Warner Robins, GA 31093
Estimated Value: $267,103 - $383,000
--
Bed
1
Bath
2,222
Sq Ft
$143/Sq Ft
Est. Value
About This Home
This home is located at 102 General Lee Rd, Warner Robins, GA 31093 and is currently estimated at $317,276, approximately $142 per square foot. 102 General Lee Rd is a home located in Houston County with nearby schools including Northside Elementary School, Northside Middle School, and Northside High School.
Ownership History
Date
Name
Owned For
Owner Type
Purchase Details
Closed on
Jun 29, 1987
Sold by
Corrective Deed
Bought by
Burke Keith A and Martha H*
Current Estimated Value
Purchase Details
Closed on
Apr 29, 1987
Sold by
Giles Wallace F and Giles Nellie S
Bought by
Burke Keith A and Martha H*
Purchase Details
Closed on
Oct 1, 1986
Sold by
Vanlandingham Vanlandingham J and Vanlandingham Ouida*
Bought by
Giles Wallace F and Giles Nellie S
Purchase Details
Closed on
Aug 12, 1986
Sold by
Vanlandingham Ouida
Bought by
Vanlandingham Ouida and Vanlandingham Jr* J
Purchase Details
Closed on
Apr 15, 1986
Sold by
Giles Wallace F and Giles Nellie S
Bought by
Vanlandingham Ouida
Purchase Details
Closed on
Nov 22, 1977
Sold by
Lord Elizabeth Jane
Bought by
Giles Wallace F and Giles Nellie S
Purchase Details
Closed on
Jul 18, 1968
Sold by
Self James W and Irene Tyson
Bought by
Lord Elizabeth Jane
Purchase Details
Closed on
Nov 28, 1967
Sold by
Kirkland G Van B
Bought by
Self James W and Irene Tyson
Create a Home Valuation Report for This Property
The Home Valuation Report is an in-depth analysis detailing your home's value as well as a comparison with similar homes in the area
Home Values in the Area
Average Home Value in this Area
Purchase History
| Date | Buyer | Sale Price | Title Company |
|---|---|---|---|
| Burke Keith A | -- | -- | |
| Burke Keith A | -- | -- | |
| Giles Wallace F | -- | -- | |
| Vanlandingham Ouida | -- | -- | |
| Vanlandingham Ouida | -- | -- | |
| Giles Wallace F | -- | -- | |
| Lord Elizabeth Jane | -- | -- | |
| Self James W | -- | -- |
Source: Public Records
Tax History Compared to Growth
Tax History
| Year | Tax Paid | Tax Assessment Tax Assessment Total Assessment is a certain percentage of the fair market value that is determined by local assessors to be the total taxable value of land and additions on the property. | Land | Improvement |
|---|---|---|---|---|
| 2024 | $1,935 | $90,000 | $13,880 | $76,120 |
| 2023 | $1,595 | $75,080 | $13,880 | $61,200 |
| 2022 | $1,417 | $67,720 | $12,720 | $55,000 |
| 2021 | $1,309 | $62,960 | $12,720 | $50,240 |
| 2020 | $1,297 | $62,240 | $12,720 | $49,520 |
| 2019 | $1,297 | $62,240 | $12,720 | $49,520 |
| 2018 | $1,470 | $62,240 | $12,720 | $49,520 |
| 2017 | $1,472 | $62,240 | $12,720 | $49,520 |
| 2016 | $1,474 | $62,240 | $12,720 | $49,520 |
| 2015 | $1,477 | $62,240 | $12,720 | $49,520 |
| 2014 | -- | $62,240 | $12,720 | $49,520 |
| 2013 | -- | $62,240 | $12,720 | $49,520 |
Source: Public Records
Map
Nearby Homes
- 102 Heritage Dr
- 107 Stonefield Ct
- 403 Fieldstone Rd
- 136 Scarborough Rd
- 106 Maple Glen Ct
- 111 Red Oak Glen
- 211 Custer Dr
- 213 Dogwood Glen
- 103 Persimmon Glen Ct
- 102 Montiego Ct
- 106 Tor Dr
- 102 Pine Glen Ct
- 94 Tiffany Ln
- 60 Tiffany Ln
- 918 Collins Ave Unit 36
- 224 Crestwood Cir
- 1089 Dunbar Rd
- 101 Kent Dr
- 152 Rock Run Trail
- 131 Martin Mill Trail
- 100 General Lee Rd
- 100 General Lee Rd Unit C2-A
- 104 General Lee Rd
- 103 General Lee Rd
- 0 General Lee Rd Unit 154714
- 0 General Lee Rd
- 101 General Lee Rd
- 110 Horseshoe Dr
- 106 General Lee Rd
- 204 Horseshoe Dr
- 108 Horseshoe Dr
- 108 General Lee Rd
- 109 Horseshoe Dr
- 106 Frog Holler Dr
- 201 Horseshoe Dr
- 107 Horseshoe Dr
- 106 Horseshoe Dr
- 104 Frog Holler Dr
- 105 Horseshoe Dr
- 203 Horseshoe Dr