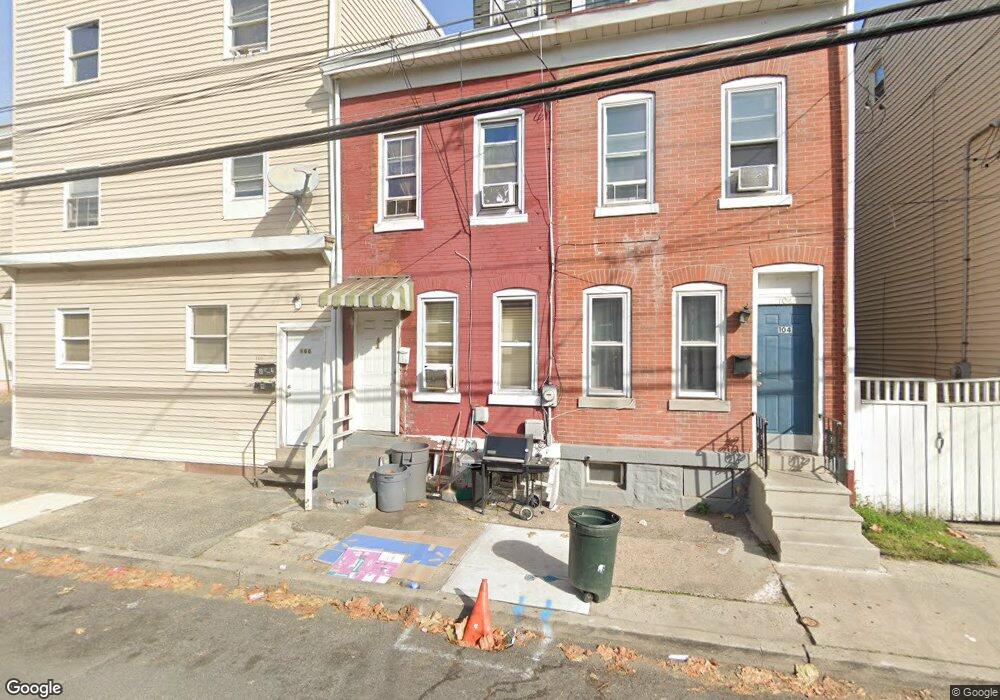
102 Hancock St Trenton, NJ 08611
South Trenton NeighborhoodEstimated Value: $144,584 - $175,000
3
Beds
1
Bath
1,008
Sq Ft
$158/Sq Ft
Est. Value
About This Home
This home is located at 102 Hancock St, Trenton, NJ 08611 and is currently estimated at $159,146, approximately $157 per square foot. 102 Hancock St is a home located in Mercer County with nearby schools including Mott Elementary School, Parker Elementary School, and Dr. Crosby Copeland Elementary School.
Ownership History
Date
Name
Owned For
Owner Type
Purchase Details
Closed on
Oct 26, 2015
Sold by
Rdo Investments Llc
Bought by
Neustein Yakov Y and Klagsbald Joel
Current Estimated Value
Purchase Details
Closed on
Jun 26, 2015
Sold by
Fannie Mae
Bought by
Rdo Investments
Purchase Details
Closed on
Nov 19, 2014
Sold by
Hua Tracy and Mu Chi Hung
Bought by
Federal National Mortgage Association
Purchase Details
Closed on
May 14, 2009
Sold by
Hua Tracy and Mu Chi Hung
Bought by
Hancock 112 Llc
Purchase Details
Closed on
Dec 16, 2003
Sold by
Brittingham John
Bought by
Mu Chi Hung and Hua Tracy
Home Financials for this Owner
Home Financials are based on the most recent Mortgage that was taken out on this home.
Original Mortgage
$56,810
Interest Rate
5.83%
Purchase Details
Closed on
Mar 5, 1998
Sold by
Mazukewicz John
Bought by
Brittingham John and Brittingham Willie Mae
Home Financials for this Owner
Home Financials are based on the most recent Mortgage that was taken out on this home.
Original Mortgage
$23,000
Interest Rate
7.03%
Create a Home Valuation Report for This Property
The Home Valuation Report is an in-depth analysis detailing your home's value as well as a comparison with similar homes in the area
Home Values in the Area
Average Home Value in this Area
Purchase History
| Date | Buyer | Sale Price | Title Company |
|---|---|---|---|
| Neustein Yakov Y | $39,000 | Gold Crest Abstract Llc | |
| Rdo Investments | $22,500 | Agent For Fidelity Natl Titl | |
| Federal National Mortgage Association | -- | None Available | |
| Hancock 112 Llc | -- | None Available | |
| Mu Chi Hung | $59,800 | -- | |
| Brittingham John | $31,000 | -- |
Source: Public Records
Mortgage History
| Date | Status | Borrower | Loan Amount |
|---|---|---|---|
| Previous Owner | Mu Chi Hung | $56,810 | |
| Previous Owner | Brittingham John | $23,000 |
Source: Public Records
Tax History Compared to Growth
Tax History
| Year | Tax Paid | Tax Assessment Tax Assessment Total Assessment is a certain percentage of the fair market value that is determined by local assessors to be the total taxable value of land and additions on the property. | Land | Improvement |
|---|---|---|---|---|
| 2025 | $1,984 | $34,200 | $8,400 | $25,800 |
| 2024 | $1,904 | $34,200 | $8,400 | $25,800 |
| 2023 | $1,904 | $34,200 | $8,400 | $25,800 |
| 2022 | $1,867 | $34,200 | $8,400 | $25,800 |
| 2021 | $1,899 | $34,200 | $8,400 | $25,800 |
| 2020 | $1,893 | $34,200 | $8,400 | $25,800 |
| 2019 | $1,863 | $34,200 | $8,400 | $25,800 |
| 2018 | $1,783 | $34,200 | $8,400 | $25,800 |
| 2017 | $1,695 | $34,200 | $8,400 | $25,800 |
| 2016 | $2,583 | $44,900 | $14,700 | $30,200 |
| 2015 | $2,574 | $44,900 | $14,700 | $30,200 |
| 2014 | $2,562 | $44,900 | $14,700 | $30,200 |
Source: Public Records
Map
Nearby Homes