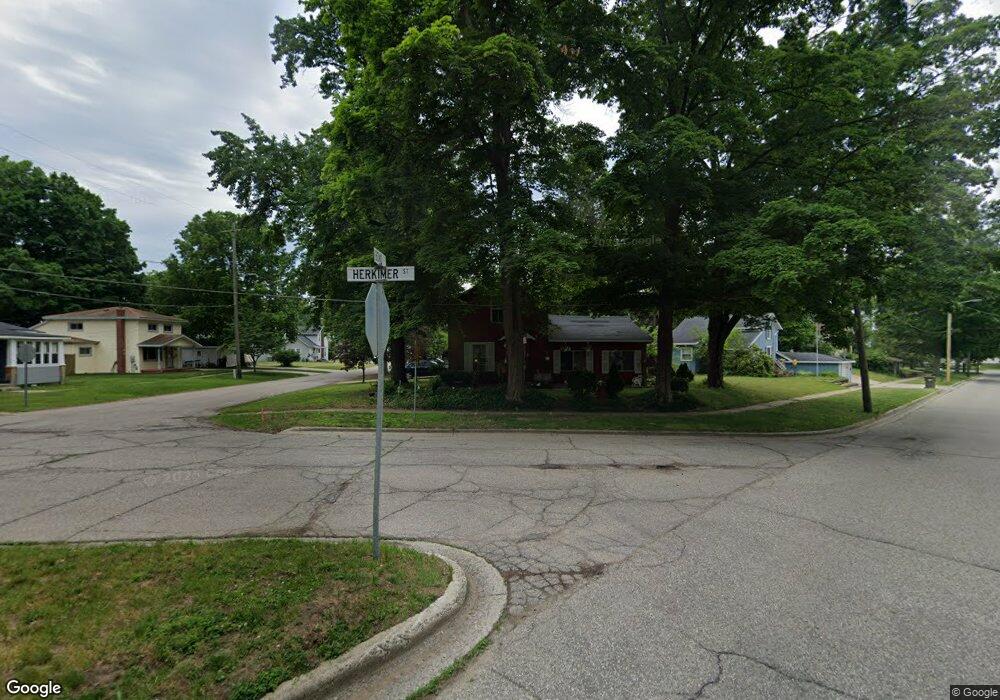
102 Herkimer St Allegan, MI 49010
Estimated Value: $162,012 - $197,000
3
Beds
1
Bath
1,431
Sq Ft
$127/Sq Ft
Est. Value
About This Home
This home is located at 102 Herkimer St, Allegan, MI 49010 and is currently estimated at $182,003, approximately $127 per square foot. 102 Herkimer St is a home located in Allegan County with nearby schools including Pine Trails Elementary School, L.E. White Middle School, and Allegan High School.
Ownership History
Date
Name
Owned For
Owner Type
Purchase Details
Closed on
Sep 21, 2009
Sold by
Christman Vern S and Christman Margie A
Bought by
Kizer Robert W and Kizer Shannon R
Current Estimated Value
Purchase Details
Closed on
Apr 18, 2002
Sold by
Hopkins Jeff A and Hopkins Lisa L
Bought by
Bank One National Assn
Purchase Details
Closed on
Jul 23, 1999
Sold by
Julien John G and Julien Diane
Bought by
Hopkins Jeff and Hopkins Lisa
Purchase Details
Closed on
Jul 19, 1996
Sold by
Julien John G and Julien Diane
Bought by
Hopkins and Hopkins Morey
Purchase Details
Closed on
Jul 18, 1996
Bought by
Julien John G and Julien Diane J
Create a Home Valuation Report for This Property
The Home Valuation Report is an in-depth analysis detailing your home's value as well as a comparison with similar homes in the area
Home Values in the Area
Average Home Value in this Area
Purchase History
| Date | Buyer | Sale Price | Title Company |
|---|---|---|---|
| Kizer Robert W | -- | None Available | |
| Bank One National Assn | $48,800 | -- | |
| Hopkins Jeff | $38,900 | -- | |
| Hopkins | $38,900 | -- | |
| Julien John G | -- | -- |
Source: Public Records
Tax History Compared to Growth
Tax History
| Year | Tax Paid | Tax Assessment Tax Assessment Total Assessment is a certain percentage of the fair market value that is determined by local assessors to be the total taxable value of land and additions on the property. | Land | Improvement |
|---|---|---|---|---|
| 2025 | $804 | $53,200 | $8,600 | $44,600 |
| 2024 | $732 | $46,300 | $7,500 | $38,800 |
| 2023 | $758 | $40,300 | $7,100 | $33,200 |
| 2022 | $732 | $35,700 | $5,900 | $29,800 |
| 2021 | $700 | $34,000 | $4,700 | $29,300 |
| 2020 | $690 | $26,100 | $4,300 | $21,800 |
| 2019 | $673 | $24,100 | $4,000 | $20,100 |
| 2018 | $646 | $18,900 | $3,900 | $15,000 |
| 2017 | $0 | $17,400 | $3,300 | $14,100 |
| 2016 | $0 | $14,400 | $2,700 | $11,700 |
| 2015 | -- | $14,400 | $2,700 | $11,700 |
| 2014 | -- | $15,100 | $2,700 | $12,400 |
| 2013 | $814 | $16,000 | $2,700 | $13,300 |
Source: Public Records
Map
Nearby Homes