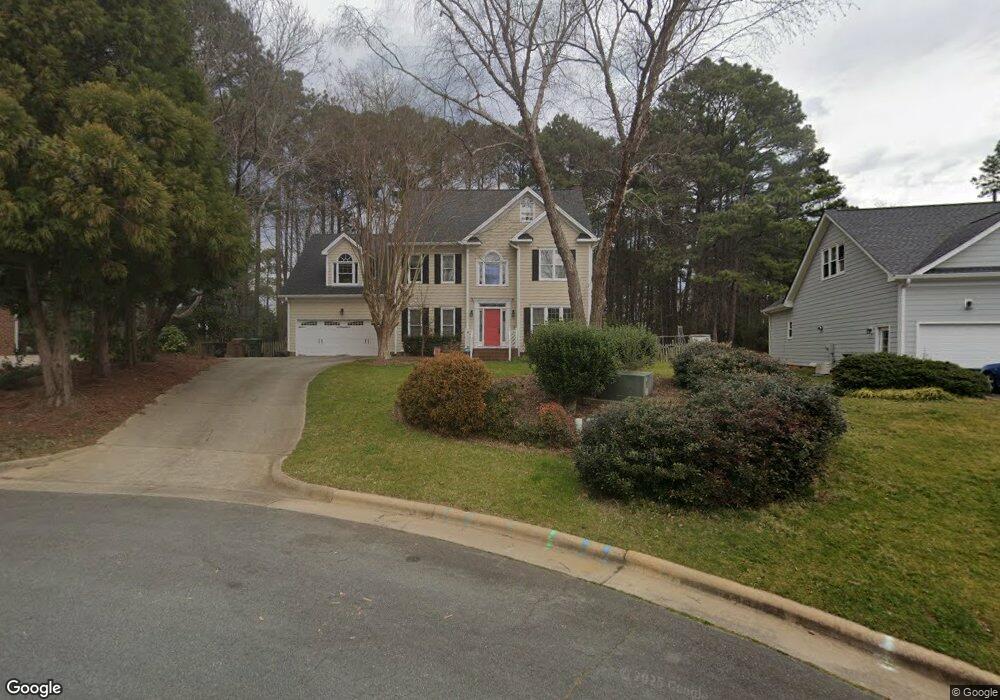
102 Hobblebrook Ct Cary, NC 27518
Middle Creek NeighborhoodEstimated Value: $922,686 - $1,020,000
4
Beds
4
Baths
3,900
Sq Ft
$251/Sq Ft
Est. Value
About This Home
This home is located at 102 Hobblebrook Ct, Cary, NC 27518 and is currently estimated at $978,672, approximately $250 per square foot. 102 Hobblebrook Ct is a home located in Wake County with nearby schools including Penny Road Elementary School, Dillard Drive Magnet Middle School, and Resurrection Lutheran School.
Ownership History
Date
Name
Owned For
Owner Type
Purchase Details
Closed on
Jul 18, 2025
Sold by
Gleason Michael John and Gleason Gretchen Lee
Bought by
Michael John Gleason And Gretchen Lee Gleason and Gleason
Current Estimated Value
Purchase Details
Closed on
Apr 30, 2020
Sold by
Childers Wayne H and Childers Susannah
Bought by
Gleason Michael John and Gleason Gretchen Lee
Home Financials for this Owner
Home Financials are based on the most recent Mortgage that was taken out on this home.
Original Mortgage
$276,500
Interest Rate
3.6%
Mortgage Type
New Conventional
Purchase Details
Closed on
Mar 2, 2001
Sold by
Haglund Michael M
Bought by
Childers Wayne H and Childers Susannah
Home Financials for this Owner
Home Financials are based on the most recent Mortgage that was taken out on this home.
Original Mortgage
$265,000
Interest Rate
7.06%
Create a Home Valuation Report for This Property
The Home Valuation Report is an in-depth analysis detailing your home's value as well as a comparison with similar homes in the area
Home Values in the Area
Average Home Value in this Area
Purchase History
| Date | Buyer | Sale Price | Title Company |
|---|---|---|---|
| Michael John Gleason And Gretchen Lee Gleason | -- | None Listed On Document | |
| Michael John Gleason And Gretchen Lee Gleason | -- | None Listed On Document | |
| Gleason Michael John | $588,000 | None Available | |
| Childers Wayne H | $398,000 | -- |
Source: Public Records
Mortgage History
| Date | Status | Borrower | Loan Amount |
|---|---|---|---|
| Previous Owner | Gleason Michael John | $276,500 | |
| Previous Owner | Childers Wayne H | $265,000 |
Source: Public Records
Tax History Compared to Growth
Tax History
| Year | Tax Paid | Tax Assessment Tax Assessment Total Assessment is a certain percentage of the fair market value that is determined by local assessors to be the total taxable value of land and additions on the property. | Land | Improvement |
|---|---|---|---|---|
| 2025 | $7,046 | $819,700 | $241,500 | $578,200 |
| 2024 | $6,893 | $819,700 | $241,500 | $578,200 |
| 2023 | $4,911 | $488,074 | $140,000 | $348,074 |
| 2022 | $4,727 | $488,074 | $140,000 | $348,074 |
| 2021 | $4,632 | $488,074 | $140,000 | $348,074 |
| 2020 | $4,657 | $488,074 | $140,000 | $348,074 |
| 2019 | $4,648 | $432,233 | $110,000 | $322,233 |
| 2018 | $4,361 | $432,233 | $110,000 | $322,233 |
| 2017 | $4,191 | $432,233 | $110,000 | $322,233 |
| 2016 | $4,128 | $432,233 | $110,000 | $322,233 |
| 2015 | $4,680 | $473,336 | $102,000 | $371,336 |
| 2014 | $4,413 | $473,336 | $102,000 | $371,336 |
Source: Public Records
Map
Nearby Homes
- 329 Lady Marian Ct
- 127 Kelekent Ln
- 101 Saint Brides Ct
- 644 Angelica Cir
- 204 Oxford Mill Ct
- 114 Kendleton Place
- 1020 Regency Cottage Place
- 938 Regency Cottage Place
- 1209 Waterford Green Dr
- 2014 Waterton Ln
- 2002 Red Sage Ct
- 3117 Ten Rd
- 102 Forest Edge Dr
- 1811 Green Ford Ln
- 2332 Turpentine Dr
- Cooper Plan at Horton Park - The Estates
- Ashley Plan at Horton Park
- STELLA Plan at Horton Park
- Gavin Plan at Horton Park
- Edisto Plan at Horton Park
- 100 Hobblebrook Ct
- 104 Hobblebrook Ct
- 104 Breyman Ct
- 303 Southglen Dr
- 102 Breyman Ct
- 106 Breyman Ct
- 103 Hobblebrook Ct
- 303 Gentlewoods Dr
- 305 Southglen Dr
- 203 Southglen Dr
- 100 Breyman Ct
- 305 Gentlewoods Dr
- 302 Southglen Dr
- 307 Gentlewoods Dr
- 105 Breyman Ct
- 300 Southglen Dr
- 109 Southglen Dr
- 307 Southglen Dr
- 204 Southglen Dr
- 118 Parson Woods Ln