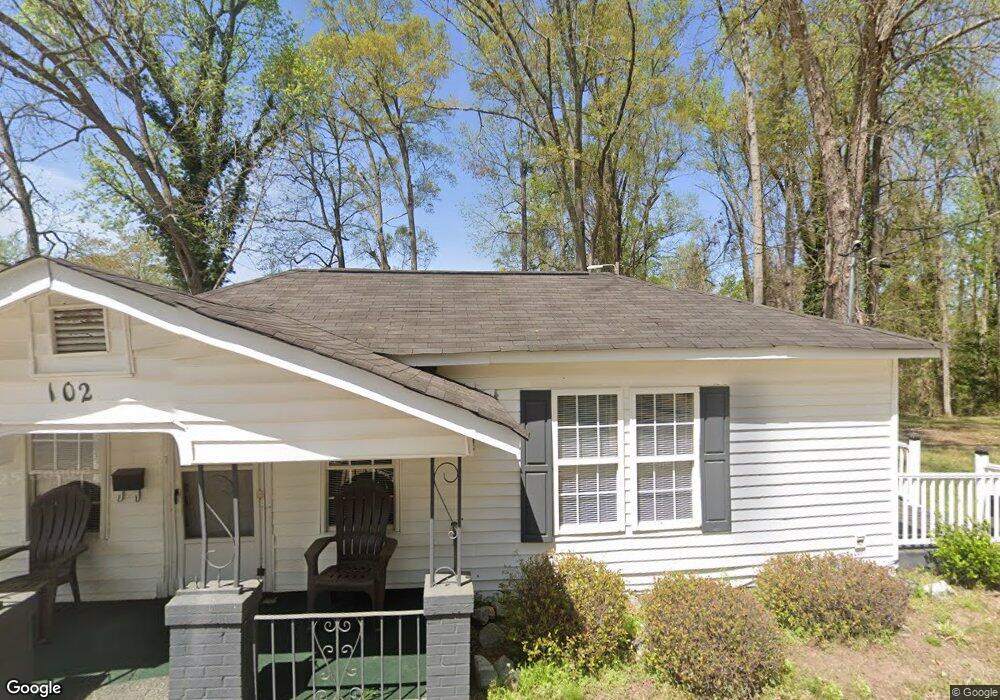
102 Holloway Blvd Belton, SC 29627
Estimated Value: $132,284 - $228,000
2
Beds
--
Bath
1,117
Sq Ft
$157/Sq Ft
Est. Value
About This Home
This home is located at 102 Holloway Blvd, Belton, SC 29627 and is currently estimated at $175,571, approximately $157 per square foot. 102 Holloway Blvd is a home located in Anderson County with nearby schools including Belton Honea Path High School.
Ownership History
Date
Name
Owned For
Owner Type
Purchase Details
Closed on
Oct 13, 2022
Sold by
Jc Group Llc
Bought by
Robinson Group Of South Carolina Llc
Current Estimated Value
Home Financials for this Owner
Home Financials are based on the most recent Mortgage that was taken out on this home.
Original Mortgage
$69,583
Outstanding Balance
$66,950
Interest Rate
6.02%
Mortgage Type
New Conventional
Estimated Equity
$108,621
Purchase Details
Closed on
Jul 19, 2004
Sold by
Douglas Connie and Gambrell Connie
Bought by
Jc Group Llc
Create a Home Valuation Report for This Property
The Home Valuation Report is an in-depth analysis detailing your home's value as well as a comparison with similar homes in the area
Home Values in the Area
Average Home Value in this Area
Purchase History
| Date | Buyer | Sale Price | Title Company |
|---|---|---|---|
| Robinson Group Of South Carolina Llc | $190,000 | -- | |
| Jc Group Llc | $5,977 | -- |
Source: Public Records
Mortgage History
| Date | Status | Borrower | Loan Amount |
|---|---|---|---|
| Open | Robinson Group Of South Carolina Llc | $69,583 |
Source: Public Records
Tax History Compared to Growth
Tax History
| Year | Tax Paid | Tax Assessment Tax Assessment Total Assessment is a certain percentage of the fair market value that is determined by local assessors to be the total taxable value of land and additions on the property. | Land | Improvement |
|---|---|---|---|---|
| 2024 | $1,952 | $3,900 | $560 | $3,340 |
| 2023 | $1,952 | $4,820 | $560 | $4,260 |
| 2022 | $1,199 | $4,820 | $560 | $4,260 |
| 2021 | $1,064 | $4,210 | $510 | $3,700 |
| 2020 | $1,054 | $4,210 | $510 | $3,700 |
| 2019 | $1,050 | $4,210 | $510 | $3,700 |
| 2018 | $1,046 | $4,210 | $510 | $3,700 |
| 2017 | -- | $4,210 | $510 | $3,700 |
| 2016 | $901 | $4,020 | $300 | $3,720 |
| 2015 | $919 | $4,020 | $300 | $3,720 |
| 2014 | $910 | $4,020 | $300 | $3,720 |
Source: Public Records
Map
Nearby Homes