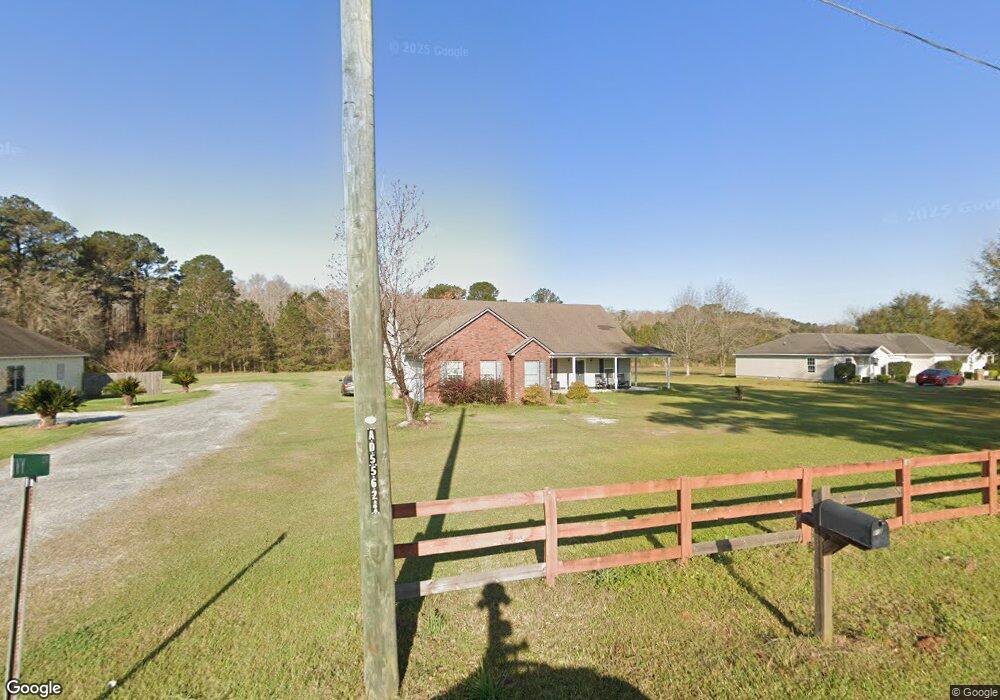
102 Ivy Cir Sparks, GA 31647
Estimated Value: $213,000 - $253,000
3
Beds
2
Baths
2,102
Sq Ft
$113/Sq Ft
Est. Value
About This Home
This home is located at 102 Ivy Cir, Sparks, GA 31647 and is currently estimated at $237,803, approximately $113 per square foot. 102 Ivy Cir is a home located in Cook County with nearby schools including Cook Primary School, Cook Elementary School, and Cook County Middle School.
Ownership History
Date
Name
Owned For
Owner Type
Purchase Details
Closed on
Nov 16, 2017
Sold by
Gibson Tonyia L
Bought by
Scruggs Tanashia
Current Estimated Value
Home Financials for this Owner
Home Financials are based on the most recent Mortgage that was taken out on this home.
Original Mortgage
$135,500
Outstanding Balance
$115,435
Interest Rate
4.5%
Mortgage Type
FHA
Estimated Equity
$122,368
Purchase Details
Closed on
Aug 31, 2012
Sold by
The Citizens Bank
Bought by
Gibson Tonyia L and Gibson Gary C
Home Financials for this Owner
Home Financials are based on the most recent Mortgage that was taken out on this home.
Original Mortgage
$125,875
Interest Rate
3.58%
Mortgage Type
New Conventional
Purchase Details
Closed on
Sep 6, 2011
Sold by
Hurley Patrick Oneal
Bought by
The Citizens Bank
Purchase Details
Closed on
Apr 28, 2010
Sold by
Kelly Brett
Bought by
Hurley Patrick Oneal
Create a Home Valuation Report for This Property
The Home Valuation Report is an in-depth analysis detailing your home's value as well as a comparison with similar homes in the area
Home Values in the Area
Average Home Value in this Area
Purchase History
| Date | Buyer | Sale Price | Title Company |
|---|---|---|---|
| Scruggs Tanashia | $138,000 | -- | |
| Gibson Tonyia L | $132,500 | -- | |
| The Citizens Bank | $117,006 | -- | |
| Hurley Patrick Oneal | $155,000 | -- |
Source: Public Records
Mortgage History
| Date | Status | Borrower | Loan Amount |
|---|---|---|---|
| Open | Scruggs Tanashia | $135,500 | |
| Previous Owner | Gibson Tonyia L | $125,875 |
Source: Public Records
Tax History Compared to Growth
Tax History
| Year | Tax Paid | Tax Assessment Tax Assessment Total Assessment is a certain percentage of the fair market value that is determined by local assessors to be the total taxable value of land and additions on the property. | Land | Improvement |
|---|---|---|---|---|
| 2024 | $2,558 | $75,078 | $2,412 | $72,666 |
| 2023 | $2,205 | $64,722 | $2,154 | $62,568 |
| 2022 | $1,743 | $64,722 | $2,154 | $62,568 |
| 2021 | $1,542 | $53,396 | $2,154 | $51,242 |
| 2020 | $1,542 | $53,396 | $2,154 | $51,242 |
| 2019 | $1,543 | $53,396 | $2,154 | $51,242 |
| 2018 | $1,955 | $53,396 | $2,154 | $51,242 |
| 2017 | $1,544 | $53,396 | $2,154 | $51,242 |
| 2016 | $1,547 | $53,396 | $2,154 | $51,242 |
| 2015 | $1,487 | $53,182 | $1,940 | $51,242 |
| 2014 | $1,490 | $53,182 | $1,940 | $51,242 |
| 2013 | -- | $53,182 | $1,940 | $51,242 |
Source: Public Records
Map
Nearby Homes
- 103 N College St
- 134 Brandy Ct
- 284 Barrett Rd
- 105 Orchard Cir
- 120 Westover Dr
- 123 Westover Dr
- 2302 Thomas St
- 4711 Highway 37
- 703 N Elm St
- 1402 Bear Creek Rd
- 1306 Bear Creek Rd
- 2603 Dianne St
- 2503 Dianne St
- 701 Gloria St
- 304 E 3rd St
- 418 E 3rd St
- 315 Newton Dr
- 211 S Gordon Ave
- 515 John Keigans Memorial
- 625 Coxstill Rd