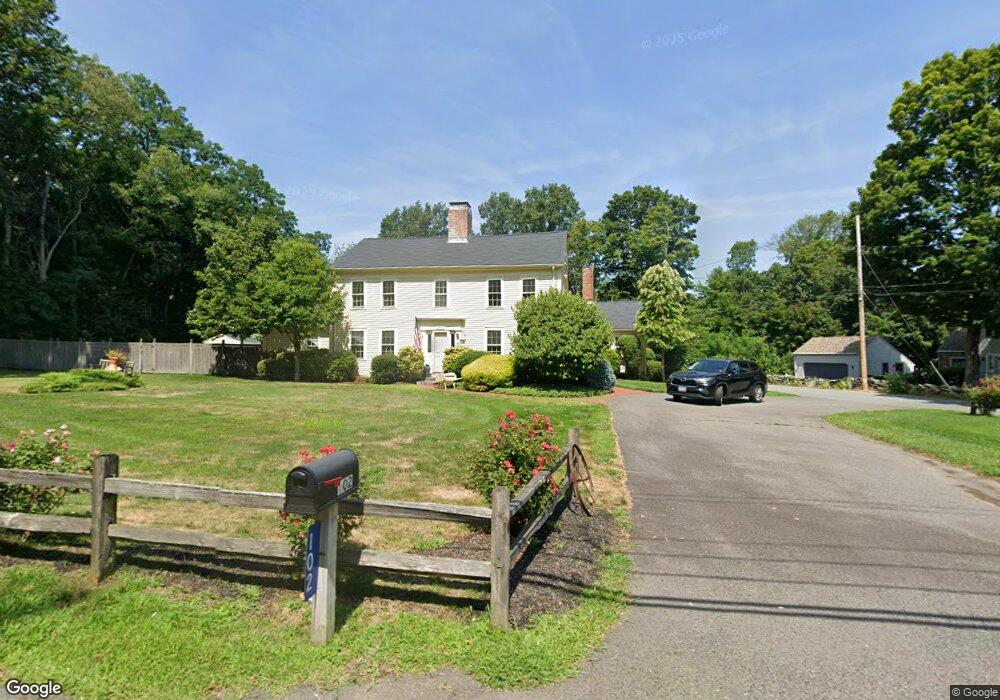
102 Judson St Raynham, MA 02767
Estimated Value: $785,000 - $845,000
4
Beds
3
Baths
3,494
Sq Ft
$233/Sq Ft
Est. Value
About This Home
This home is located at 102 Judson St, Raynham, MA 02767 and is currently estimated at $815,194, approximately $233 per square foot. 102 Judson St is a home located in Bristol County with nearby schools including Merrill Elementary School, LaLiberte Elementary School, and Williams Intermediate School.
Ownership History
Date
Name
Owned For
Owner Type
Purchase Details
Closed on
May 2, 2025
Sold by
Jones Christopher S and Jones Margaret E
Bought by
Jones Jeffrey
Current Estimated Value
Purchase Details
Closed on
Aug 22, 1977
Bought by
Jones Christopher S and Jones Margaret E
Create a Home Valuation Report for This Property
The Home Valuation Report is an in-depth analysis detailing your home's value as well as a comparison with similar homes in the area
Home Values in the Area
Average Home Value in this Area
Purchase History
| Date | Buyer | Sale Price | Title Company |
|---|---|---|---|
| Jones Jeffrey | $800,000 | None Available | |
| Jones Jeffrey | $800,000 | None Available | |
| Jones Christopher S | $57,000 | -- |
Source: Public Records
Mortgage History
| Date | Status | Borrower | Loan Amount |
|---|---|---|---|
| Previous Owner | Jones Christopher S | $100,000 | |
| Previous Owner | Jones Christopher S | $60,000 |
Source: Public Records
Tax History
| Year | Tax Paid | Tax Assessment Tax Assessment Total Assessment is a certain percentage of the fair market value that is determined by local assessors to be the total taxable value of land and additions on the property. | Land | Improvement |
|---|---|---|---|---|
| 2025 | $8,333 | $688,700 | $214,600 | $474,100 |
| 2024 | $7,954 | $640,400 | $195,100 | $445,300 |
| 2023 | $7,616 | $560,000 | $175,600 | $384,400 |
| 2022 | $7,569 | $510,400 | $165,900 | $344,500 |
| 2021 | $0 | $500,600 | $156,100 | $344,500 |
| 2020 | $7,025 | $487,500 | $148,300 | $339,200 |
| 2019 | $6,798 | $477,700 | $138,500 | $339,200 |
| 2018 | $0 | $433,100 | $130,700 | $302,400 |
| 2017 | $0 | $399,200 | $124,900 | $274,300 |
| 2016 | $5,856 | $390,900 | $121,000 | $269,900 |
| 2015 | $5,278 | $346,300 | $125,700 | $220,600 |
Source: Public Records
Map
Nearby Homes
- 75 Warren St W Unit 16
- 0 Cape Highway Route 44 Unit 73474847
- 5 Parcels Cape Highway Route 44
- 51 Tucker Terrace
- 22 Highland Rd Unit 29
- 53 Queens Cir
- 73 Raymond Ave
- 55 Bally Dr
- 935 King St
- 15 Carlton St
- 152 Forgeriver
- 14 Amber Way
- 70 Sandy Hill Rd
- 30 Edward Rd
- 28 Barbara Rd
- 208 S Main St
- 21 Sully Rd
- 222 Harris St
- 32 Kendall Ct
- 0 S Main St Unit 73443212
Your Personal Tour Guide
Ask me questions while you tour the home.