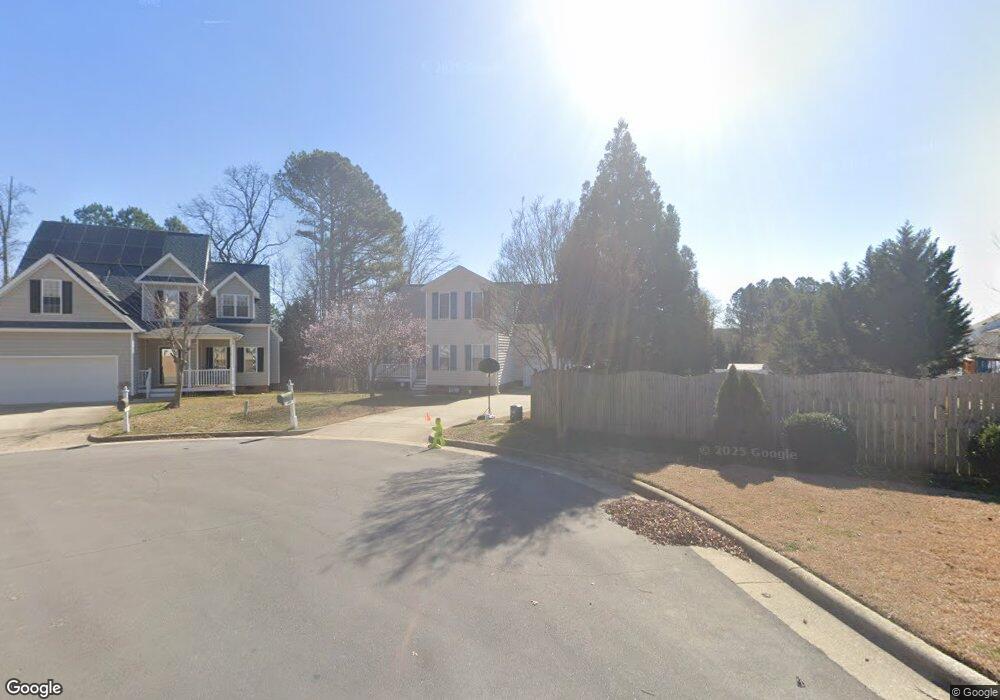
102 Kelly Brook Ct Apex, NC 27502
West Apex NeighborhoodEstimated Value: $512,000 - $549,000
4
Beds
4
Baths
2,118
Sq Ft
$250/Sq Ft
Est. Value
About This Home
This home is located at 102 Kelly Brook Ct, Apex, NC 27502 and is currently estimated at $529,000, approximately $249 per square foot. 102 Kelly Brook Ct is a home located in Wake County with nearby schools including Olive Chapel Elementary School, Lufkin Road Middle School, and Apex Friendship High School.
Ownership History
Date
Name
Owned For
Owner Type
Purchase Details
Closed on
Oct 3, 2016
Sold by
Gordon Wendy Pettengill and Gordon Richard
Bought by
Czyzewski Shayne and Czyzewski Ramie
Current Estimated Value
Home Financials for this Owner
Home Financials are based on the most recent Mortgage that was taken out on this home.
Original Mortgage
$289,900
Outstanding Balance
$232,188
Interest Rate
3.43%
Mortgage Type
VA
Estimated Equity
$296,812
Purchase Details
Closed on
Dec 21, 2003
Sold by
Saymar Custom Homes Inc
Bought by
Gordon Wendy Pettengill
Home Financials for this Owner
Home Financials are based on the most recent Mortgage that was taken out on this home.
Original Mortgage
$175,115
Interest Rate
6.05%
Mortgage Type
FHA
Purchase Details
Closed on
Jan 30, 2002
Sold by
Kelly West Associates Llc
Bought by
Saymar Custom Homes Inc and Raleigh Homes Inc
Create a Home Valuation Report for This Property
The Home Valuation Report is an in-depth analysis detailing your home's value as well as a comparison with similar homes in the area
Home Values in the Area
Average Home Value in this Area
Purchase History
| Date | Buyer | Sale Price | Title Company |
|---|---|---|---|
| Czyzewski Shayne | $290,000 | None Available | |
| Gordon Wendy Pettengill | $176,500 | -- | |
| Saymar Custom Homes Inc | $29,000 | -- |
Source: Public Records
Mortgage History
| Date | Status | Borrower | Loan Amount |
|---|---|---|---|
| Open | Czyzewski Shayne | $289,900 | |
| Previous Owner | Gordon Wendy Pettengill | $175,115 |
Source: Public Records
Tax History Compared to Growth
Tax History
| Year | Tax Paid | Tax Assessment Tax Assessment Total Assessment is a certain percentage of the fair market value that is determined by local assessors to be the total taxable value of land and additions on the property. | Land | Improvement |
|---|---|---|---|---|
| 2025 | $4,344 | $495,280 | $180,000 | $315,280 |
| 2024 | $4,247 | $495,280 | $180,000 | $315,280 |
| 2023 | $3,631 | $329,127 | $80,000 | $249,127 |
| 2022 | $3,408 | $329,127 | $80,000 | $249,127 |
| 2021 | $3,278 | $329,127 | $80,000 | $249,127 |
| 2020 | $3,245 | $329,127 | $80,000 | $249,127 |
| 2019 | $3,013 | $263,571 | $75,000 | $188,571 |
| 2018 | $2,675 | $248,303 | $75,000 | $173,303 |
| 2017 | $2,491 | $248,303 | $75,000 | $173,303 |
| 2016 | $2,455 | $248,303 | $75,000 | $173,303 |
| 2015 | $2,256 | $222,599 | $65,000 | $157,599 |
| 2014 | -- | $222,599 | $65,000 | $157,599 |
Source: Public Records
Map
Nearby Homes
- 312 Brierridge Dr
- 505 Brickstone Dr
- 105 Grassy Ridge Ct
- 1512 Piazzo Ct
- 3916 Chapel Oak Dr
- 2512 Livingston Ct
- 109 Kinship Ln
- 202 Homestead Park Dr
- 2007 Winecott Dr
- 943 Homestead Park Dr
- 107 Checker Ct
- 102 Checker Ct
- 2006 Driskill Ct
- 3119 Cregler Dr
- 2006 Jerimouth Dr
- 2108 Jerimouth Dr
- 1467 Hasse Ave
- 1329 Gordonia Way
- 2799 Cassius Dr
- 2880 Angelica Rose Way
- 104 Kelly Brook Ct
- 106 Cabin Wood Ct
- 303 Kelly West Dr
- 301 Kelly Dr W
- 301 Kelly West Dr
- 108 Cabin Wood Ct
- 303 Kelly Dr W
- 305 Kelly West Dr
- 104 Cabin Wood Ct
- 305 Kelly Dr W
- 105 Kelly Brook Ct
- 307 Kelly West Dr
- 210 Chapel Valley Ln
- 307 Kelly Dr W
- 217 Kelly West Dr
- 107 Cabin Wood Ct
- 208 Chapel Valley Ln
- 103 Kelly Brook Ct
- 217 Kelly Dr W
- 603 Kelly Dr W