Estimated Value: $186,000 - $208,000
3
Beds
2
Baths
1,239
Sq Ft
$155/Sq Ft
Est. Value
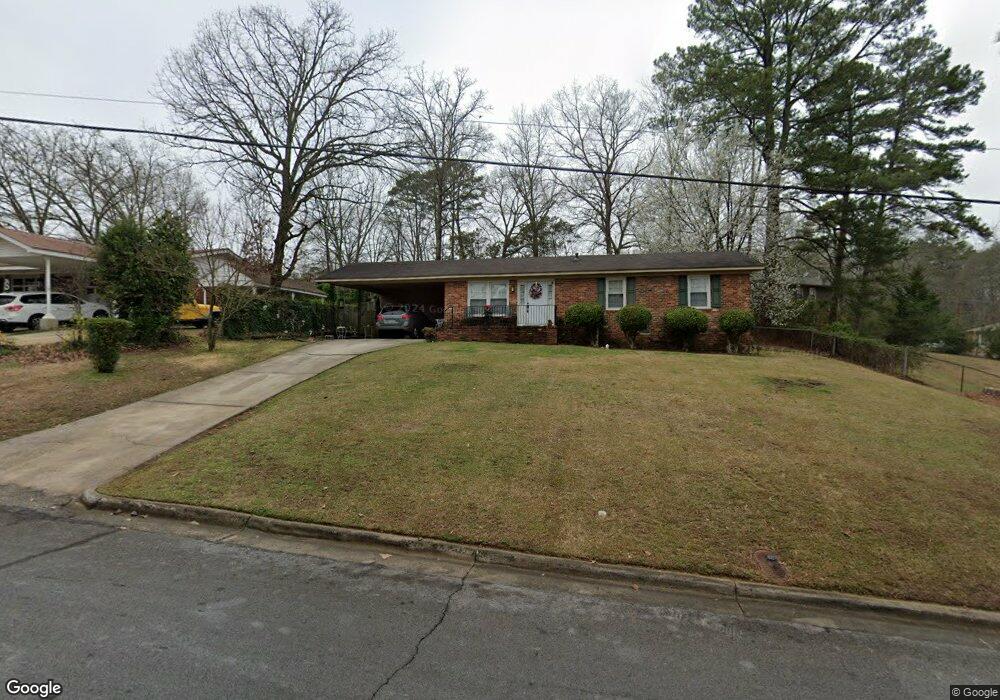
About This Home
This home is located at 102 Kenwood Dr SW, Rome, GA 30165 and is currently estimated at $191,737, approximately $154 per square foot. 102 Kenwood Dr SW is a home located in Floyd County with nearby schools including Rome High School.
Ownership History
Date
Name
Owned For
Owner Type
Purchase Details
Closed on
Aug 24, 2015
Sold by
Woodall Barbara Gayler
Bought by
St Simons Trading Co Inc
Current Estimated Value
Purchase Details
Closed on
Aug 12, 2014
Sold by
Woodall Barbara G
Bought by
Woodall Barbara G Estate
Purchase Details
Closed on
Aug 15, 1979
Sold by
Bennett Frank
Bought by
Woodall Barbara G
Purchase Details
Closed on
Dec 9, 1977
Sold by
Drawdy Richard Allen and Drawdy Charlotte
Bought by
Bennett Frank
Purchase Details
Closed on
Dec 1, 1972
Sold by
Hamill M Steven
Bought by
Drawdy Richard Allen and Drawdy Charlotte
Purchase Details
Closed on
Jan 1, 1971
Sold by
Reed Gavin
Bought by
Hamill M Steven
Purchase Details
Closed on
Jan 1, 1966
Sold by
Wilson J L
Bought by
Reed Gavin
Purchase Details
Closed on
Jan 2, 1964
Sold by
Natl City Bank
Bought by
Wilson J L
Purchase Details
Closed on
Jan 1, 1964
Sold by
Better Homes Of Rome
Bought by
Natl City Bank
Purchase Details
Closed on
Jan 1, 1963
Sold by
Fernwood Inc
Bought by
Better Homes Of Rome
Purchase Details
Closed on
Jan 1, 1901
Bought by
Fernwood Inc
Create a Home Valuation Report for This Property
The Home Valuation Report is an in-depth analysis detailing your home's value as well as a comparison with similar homes in the area
Home Values in the Area
Average Home Value in this Area
Purchase History
| Date | Buyer | Sale Price | Title Company |
|---|---|---|---|
| St Simons Trading Co Inc | $66,500 | -- | |
| Woodall Barbara G Estate | -- | -- | |
| Woodall Barbara G | $31,900 | -- | |
| Bennett Frank | $30,700 | -- | |
| Drawdy Richard Allen | -- | -- | |
| Hamill M Steven | $22,000 | -- | |
| Reed Gavin | $14,500 | -- | |
| Wilson J L | -- | -- | |
| Natl City Bank | -- | -- | |
| Better Homes Of Rome | $2,000 | -- | |
| Fernwood Inc | -- | -- |
Source: Public Records
Tax History Compared to Growth
Tax History
| Year | Tax Paid | Tax Assessment Tax Assessment Total Assessment is a certain percentage of the fair market value that is determined by local assessors to be the total taxable value of land and additions on the property. | Land | Improvement |
|---|---|---|---|---|
| 2024 | $1,757 | $53,223 | $10,825 | $42,398 |
| 2023 | $1,885 | $50,378 | $9,778 | $40,600 |
| 2022 | $1,517 | $41,585 | $8,032 | $33,553 |
| 2021 | $1,412 | $38,047 | $8,032 | $30,015 |
| 2020 | $1,287 | $34,386 | $6,111 | $28,275 |
| 2019 | $1,085 | $29,301 | $6,111 | $23,190 |
| 2018 | $1,028 | $27,777 | $6,111 | $21,666 |
| 2017 | $994 | $26,837 | $6,111 | $20,726 |
| 2016 | $971 | $26,160 | $6,080 | $20,080 |
| 2015 | $421 | $26,160 | $6,080 | $20,080 |
| 2014 | $421 | $26,601 | $6,080 | $20,521 |
Source: Public Records
Map
Nearby Homes
- 2 Thornwood Dr SW
- 106 Kenwood Dr SW
- 121 Kenwood Dr SW
- 15 Ladonna Place SW
- 9 Ladonna Place SW
- 203 Hycliff Rd SW
- 30 Westover Dr SW
- 8 Bush Arbor Place SW
- 10 Bush Arbor Place SW
- The Foxcroft Plan at North Haven
- The Benson II Plan at North Haven
- The Coleman Plan at North Haven
- The Bradley Plan at North Haven
- The McGinnis Plan at North Haven
- The Pearson Plan at North Haven
- The Caldwell Plan at North Haven
- The Grayson Plan at North Haven
- 0 Lovell Ln Unit 7662536
- 0 Lovell Ln Unit 10620627
- 125 Thornwood Dr SW
- 104 Kenwood Dr SW
- 101 Hycliff Rd SW
- 103 Hycliff Rd SW
- 105 Hycliff Rd SW
- 7 Hycliff Rd SW
- 103 Kenwood Dr SW
- 20D Hycliff Rd SW
- 105 Kenwood Dr SW
- 5 Hycliff Rd SW
- 100 Hycliff Rd SW
- 100 Hycliff Rd SW
- 100 Hycliff Rd SW Unit 36
- 107 Hycliff Rd SW
- 107 Kenwood Dr SW
- 4 Thornwood Dr SW
- 4 Thornwood Dr SW
- 108 Kenwood Dr SW
- 10 Hycliff Rd SW
- 10 Hycliff Rd SW
- 3 Hycliff Rd SW