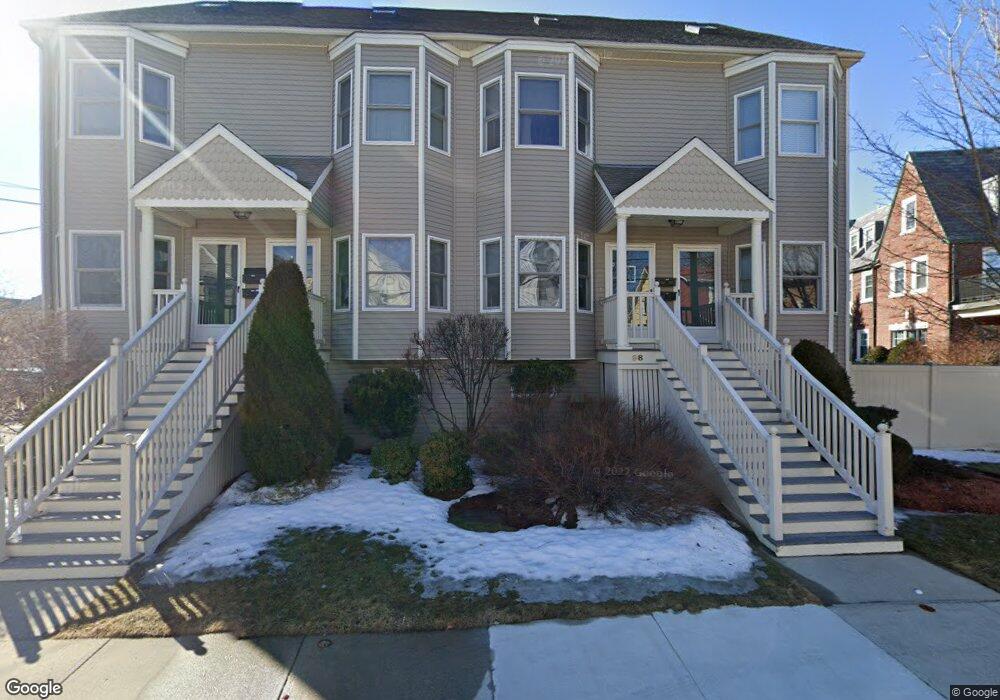
102 Kinsman St Everett, MA 02149
West Everett NeighborhoodEstimated Value: $658,000 - $733,000
3
Beds
3
Baths
1,705
Sq Ft
$416/Sq Ft
Est. Value
About This Home
This home is located at 102 Kinsman St, Everett, MA 02149 and is currently estimated at $708,429, approximately $415 per square foot. 102 Kinsman St is a home located in Middlesex County with nearby schools including Everett High School, Pioneer Charter School of Science, and St Anthony School.
Ownership History
Date
Name
Owned For
Owner Type
Purchase Details
Closed on
Apr 17, 2020
Sold by
Aubuchon Jean and Aubuchon Marc
Bought by
Yuan Shiaulou
Current Estimated Value
Home Financials for this Owner
Home Financials are based on the most recent Mortgage that was taken out on this home.
Original Mortgage
$486,400
Outstanding Balance
$430,073
Interest Rate
3.3%
Mortgage Type
New Conventional
Estimated Equity
$278,356
Purchase Details
Closed on
Jul 29, 2016
Sold by
Sean P Curran
Bought by
Aubuchon Caitlin M and Aubuchon Jean-Marc
Home Financials for this Owner
Home Financials are based on the most recent Mortgage that was taken out on this home.
Original Mortgage
$360,000
Interest Rate
3.48%
Purchase Details
Closed on
Dec 2, 2005
Sold by
Mastrocola Dev Llc
Bought by
Lane David and Curran Karen
Home Financials for this Owner
Home Financials are based on the most recent Mortgage that was taken out on this home.
Original Mortgage
$356,000
Interest Rate
6.14%
Mortgage Type
Purchase Money Mortgage
Create a Home Valuation Report for This Property
The Home Valuation Report is an in-depth analysis detailing your home's value as well as a comparison with similar homes in the area
Home Values in the Area
Average Home Value in this Area
Purchase History
| Date | Buyer | Sale Price | Title Company |
|---|---|---|---|
| Yuan Shiaulou | $608,000 | None Available | |
| Aubuchon Caitlin M | -- | -- | |
| Lane David | $445,000 | -- |
Source: Public Records
Mortgage History
| Date | Status | Borrower | Loan Amount |
|---|---|---|---|
| Open | Yuan Shiaulou | $486,400 | |
| Previous Owner | Aubuchon Caitlin M | $360,000 | |
| Previous Owner | Aubuchon Caitlin M | -- | |
| Previous Owner | Lane David | $356,000 |
Source: Public Records
Tax History
| Year | Tax Paid | Tax Assessment Tax Assessment Total Assessment is a certain percentage of the fair market value that is determined by local assessors to be the total taxable value of land and additions on the property. | Land | Improvement |
|---|---|---|---|---|
| 2025 | $7,388 | $648,600 | $0 | $648,600 |
| 2024 | $6,853 | $598,000 | $0 | $598,000 |
| 2023 | $6,805 | $577,700 | $0 | $577,700 |
| 2022 | $5,624 | $542,900 | $0 | $542,900 |
| 2021 | $5,147 | $521,500 | $0 | $521,500 |
| 2020 | $5,121 | $481,300 | $0 | $481,300 |
| 2019 | $5,206 | $420,500 | $0 | $420,500 |
| 2018 | $5,337 | $387,300 | $0 | $387,300 |
| 2017 | $4,052 | $280,600 | $0 | $280,600 |
| 2016 | $3,880 | $268,500 | $0 | $268,500 |
| 2015 | $3,872 | $265,000 | $0 | $265,000 |
Source: Public Records
Map
Nearby Homes
- 139 Bucknam St
- 210 Hancock St
- 340 Main St
- 48 Cleveland Ave
- 21 Central Ave Unit 10
- 21 Staples Ave Unit 26
- 15 Staples Ave Unit 45
- 15 Staples Ave Unit 31
- 80 Main St Unit 9
- 80 Main St Unit 4
- 171 Bell Rock St Unit 171
- 56 Valley St
- 68 Linden St Unit 49
- 67 Converse Ave Unit 69
- 44 Walnut St
- 120 Wyllis Ave Unit 401
- 89 Judson St
- 82 Medford St Unit 2
- 91-95 Medford St
- 132 Vernal St
- 185 Bucknam St
- 183 Bucknam St
- 98 Kinsman St
- 94 Kinsman St
- 90 Kinsman St
- 181-193 Bucknam St Unit Suite One
- 181-193 Bucknam St Unit PH
- 181-193 Bucknam St Unit Suite Two
- 102 Kinsman St Unit 102
- 98 Kinsman St Unit 98
- 193 Bucknam St Unit C
- 193 Bucknam St Unit B
- 193 Bucknam St Unit A
- 193 Bucknam St Unit Penthouse
- 193 Bucknam St Unit 2
- 193 Bucknam St Unit 3
- 193 Bucknam St Unit 1
- 191 Bucknam St
- 187 Bucknam St
- 187 Bucknam St Unit 187
Your Personal Tour Guide
Ask me questions while you tour the home.